Figure 5.
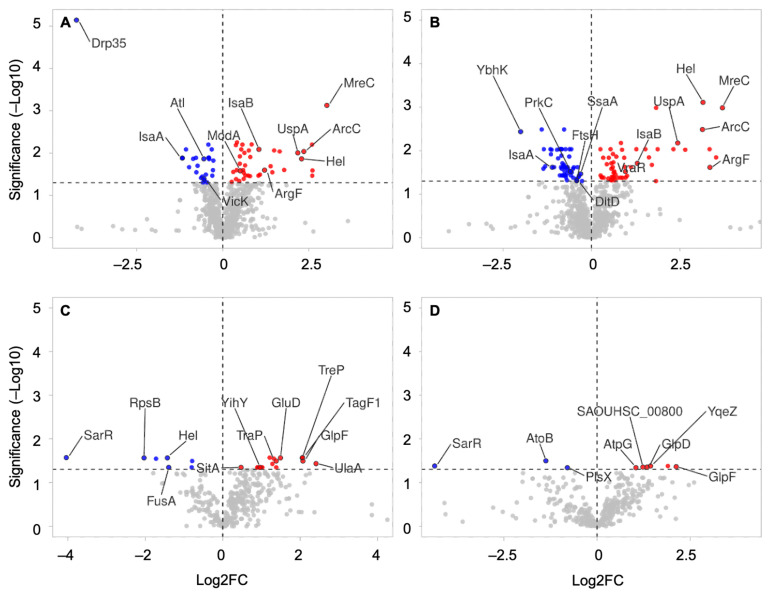
Volcano plot showing differently abundant proteins between growth phases. The graphs provide the log2 fold change (log2FC) ratios between 12 h and 6 h (12/6) conditions from WC without vancomycin (A), WC with vancomycin (B), EVs without vancomycin (C), and EVs with vancomycin (D). The vertical and horizontal dotted lines show the FC and threshold of significance (adjusted p-value < 0.05), respectively. The results are plotted in dots on a logarithmic scale, with negative log2FC in blue, positive log2FC in red, and nonsignificant values in grey.

