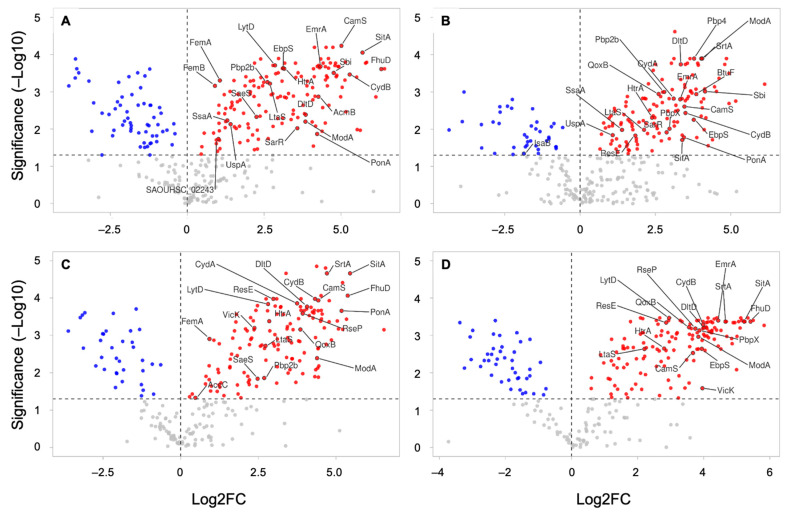
Figure 6.
Volcano plots showing the relative protein abundance between S. aureus WC and its derived EVs. The graphs provide protein log2 fold change (log2FC) ratios between EVs and WC (EV/WC) conditions at 6 h without vancomycin (6V−) (A), 6 h with vancomycin (6V+) (B), 12 h without vancomycin (12V−) (C), and 12 h with vancomycin (12V+) (D). The vertical and horizontal dotted lines show the log2FC and significance threshold (adjusted p-value < 0.05), respectively. The results are plotted on a logarithmic scale, with negative log2FC in blue, positive log2FC in red, and nonsignificant values in grey.

