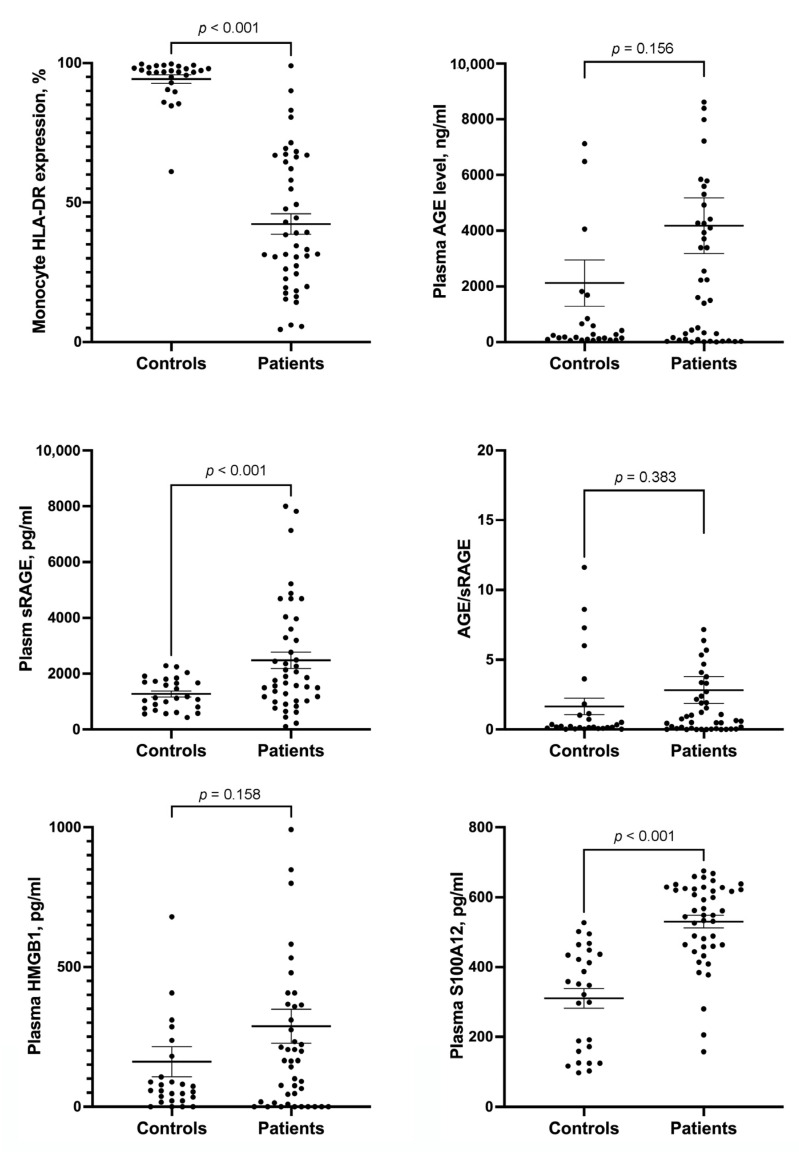
Figure 1.
Scatterplots showing the levels of monocyte HLA-DR expression, plasma AGE, plasma sRAGE, AGE/sRAGE ratio, plasma HMGB1, and plasma S100A12 between controls and patients with sepsis. Error bar represents mean and standard error mean. HLA = human leukocyte antigen; AGE = advanced glycation end products; sRAGE = soluble receptor for AGE; HMGB1 = high-mobility group box 1.

