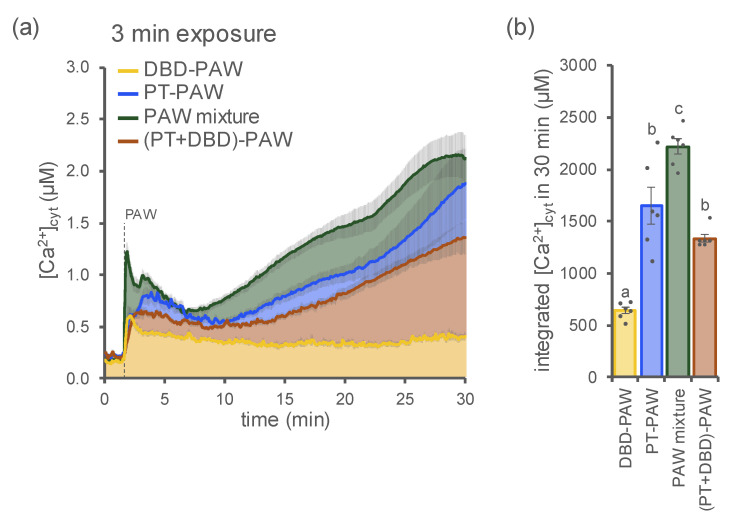
Figure 5.
Comparison of the Ca2+ signatures induced by PAWs generated by different cold plasma sources. [Ca2+]cyt elevations were measured in aequorin-expressing Arabidopsis seedlings after the administration (at 100 s, dashed line) of PAW generated by a DBD (DBD-PAW, yellow, 1:4 dilution), PAW generated by a plasma torch (PT-PAW, blue, 1:4 dilution), a PAW mixture composed of equal volumes (1:1) of both DBD-PAW and PT-PAW (green, 1:2 dilution), a double-treated PAW obtained by sequentially exposing deionized H2O to PT and DBD cold plasmas ((PT+DBD)-PAW, brown, 1:4 dilution). All PAWs were obtained by exposing deionized H2O to cold plasma for 3 min, with the DBD’s discharge frequency set at 20 kHz. (a) Data are the means (solid lines) ± SE (shadings) of the evoked [Ca2+]cyt dynamics in 6 independent seedlings. (b) Integrated [Ca2+]cyt dynamics over 30 min. Each dot represents a single biological replicate. Statistical analyses were performed according to Student’s t-test (p < 0.05), with different letters indicating significant differences.

