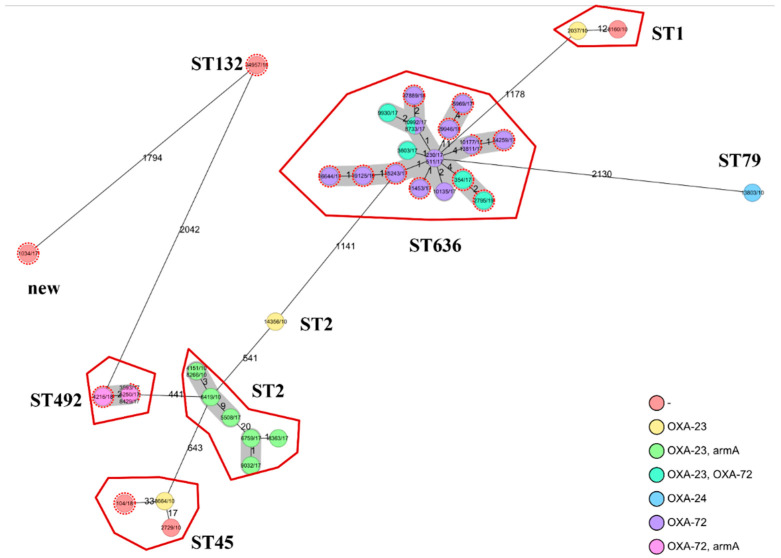
Figure 2.
Minimum spanning tree based on cgMLST allelic profiles of A. baumannii isolates. Each circle represents an allelic profile based on sequence analysis of 2390 cgMLST target genes. Circles with dashed lines represent the faecal isolates, while the solid-contoured circles show the clinical isolates, colour-grouped by genotype. The numbers on the connecting lines illustrate the number of allelic differences. Closely related genotypes (<10 allelic differences based on presence-absence) are shaded. The cgMLST data of the clinical isolates were derived from our previous study [16].

