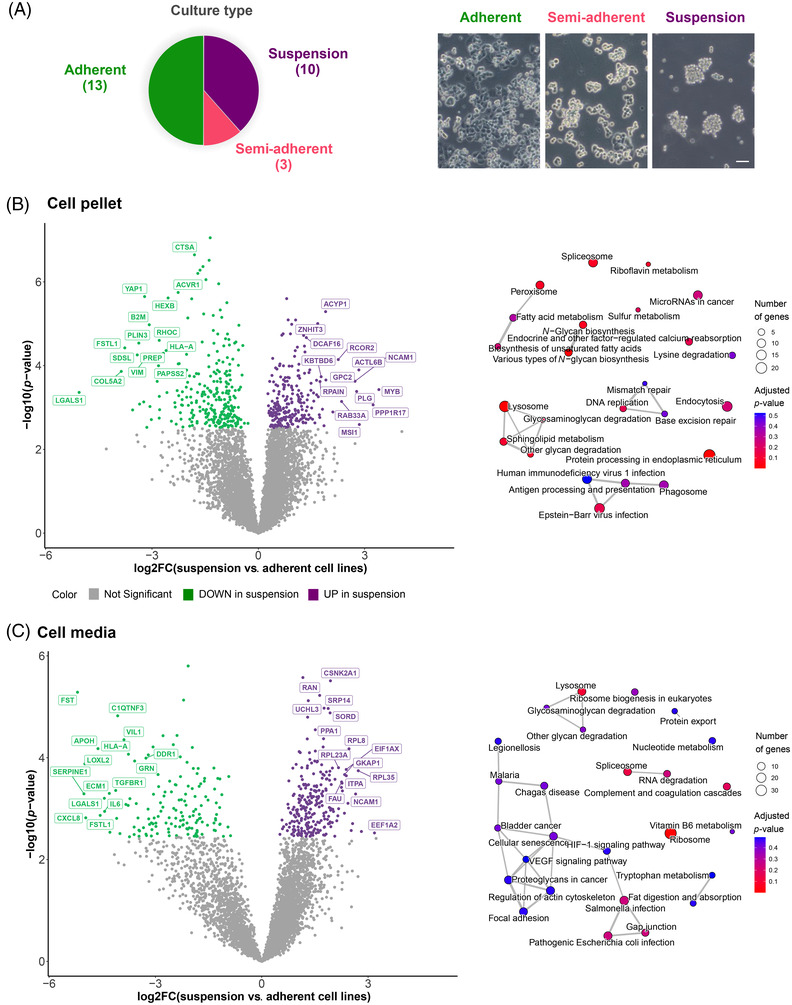
FIGURE 2.

In vitro growth characteristics mirrored in the proteome: (A) Pie chart and representative images (taken on a Zeiss Axiovert 40 C microscope) of the different culture types of small‐cell lung cancer (SCLC) cell lines (n = 26). Scale bar = 100 μm; (B) volcano plot depicting the results of differential expression analysis results between suspension and adherent cell lines (left) with the corresponding enrichment map of the overrepresented KEGG pathways (right) in the cell pellet (CP) data; (C) volcano plot depicting the results of differential expression analysis between suspension and adherent cell lines (left) with corresponding enrichment map of the overrepresented KEGG pathways (right) in the culture media (CM) data
