
FIGURE 6.
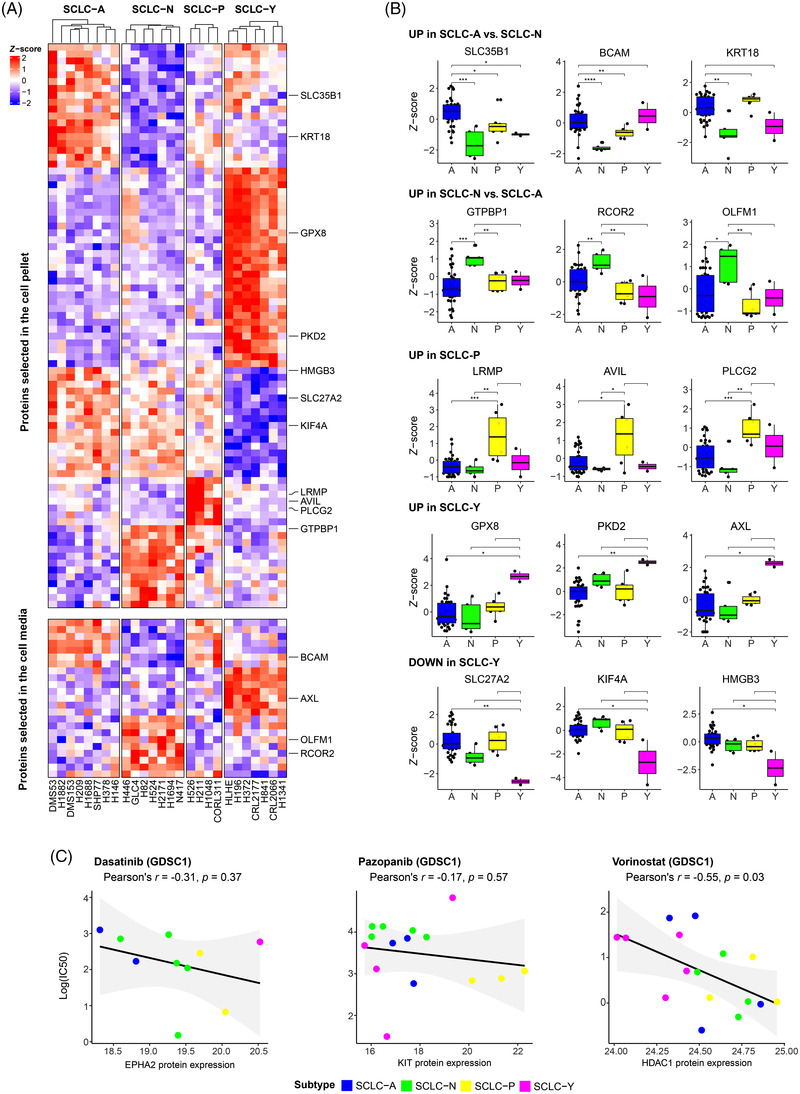
Proteins with diagnostic and therapeutic relevance in small‐cell lung cancer (SCLC) subtypes: (A) The proteins selected by partial least squares discriminant analysis (sPLS‐DA), which are suitable for separating the subtypes based on their expression profile. Results from cell pellet (CP) and culture media (CM) are displayed on the top and bottom heat map, respectively. Proteins with the best matching expression profiles between cell line proteomics and tissue transcriptomics are highlighted; (B) gene expression differences of the best matching transcripts showing subtype‐specific expression profile. The significance of Wilcoxon tests is indicated above the boxplots (*p < 0.05; **p < 0.01; ***p < 0.001); (C) the ln(IC50) values of the cell lines for drugs selected from the Genomics of Drug Sensitivity in Cancer 1 (GDSC1) database (from left to right: dasatinib, pazopanib, and vorinostat), as a function of the measured protein expression. The results of the Pearson correlation analysis are indicated above the scatter plots. Dots are coloured according to the cell line's subtype assignment.