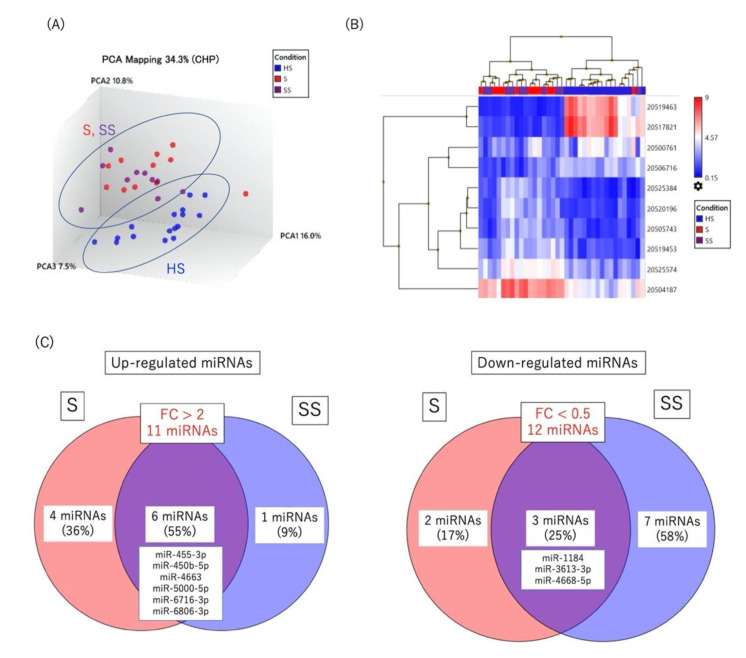
Figure 3.
(A) Principal component analysis, (B) unsupervised hierarchical clustering analysis, (C) Venn diagrams showing miRNAs significantly up-regulated (>2.0-fold change) or down-regulated (<0.5-fold change) in diagnosed ocular sarcoidosis or suspected ocular sarcoidosis compared to healthy control subjects (p < 0.05). FC: fold change, HS: healthy subjects, S: diagnosed ocular sarcoidosis, SS: suspected ocular sarcoidosis.

