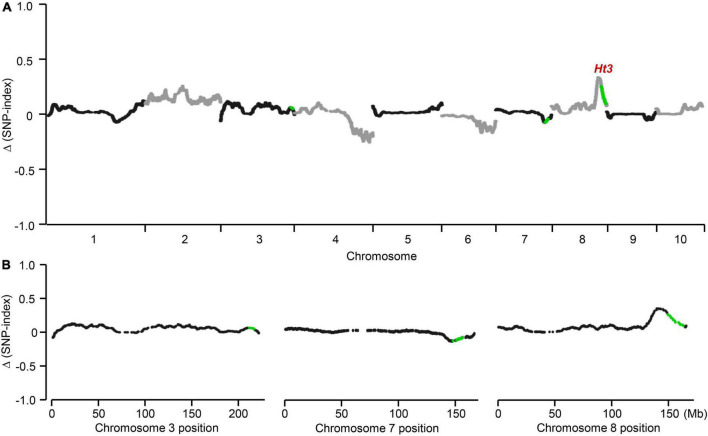
FIGURE 2.
Initial detection of the Ht3L locus. In the BC2F1 segregating population, highly resistant and susceptible individuals were selected to prepare two blocks. SNP-index value which represents the heterozygosity was estimated for each SNP. (A) Genome-wide association mapping of Ht3L locus. (B) Ht3L was located in bin 8.06. Difference in SNP-index between two bulks, Δ(SNP-index), was calculated for all SNPs and used for genome-wide association. The average Δ(SNP-index) was calculated using a sliding window analysis with 10-Mb window size and 10-kb increments. Each plot represents a SNP marker, and the green plots correspond to the significantly associated SNPs in NILs analysis. The Ht3L locus was identified as a peak of the Δ(SNP-index) in bin 8.06.

