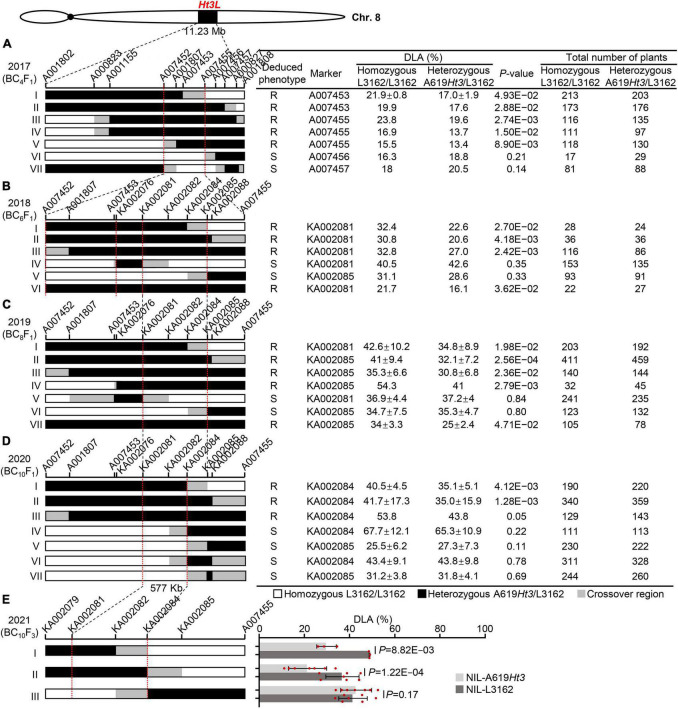
FIGURE 3.
Sequential fine-mapping of the Ht3L locus by using the recombinant-derived progeny. The vertical bars mark the sites of key molecular markers. The red dotted lines indicate the left and right boundaries of the mapped Ht3L. The chromosomal composition at Ht3L is depicted as black, white, and gray rectangles, representing heterozygous A619Ht3/L3162, homozygous L3162/L3162, and recombination breakpoint regions, respectively. The total number of plants refers to all progeny of a given recombinant. The significant difference in DLA among genotypes was calculated using t-test. A significant difference in DLA (P < 0.05) between heterozygous and homozygous offsprings indicated the presence of Ht3L in the A619Ht3 donor region, and the corresponding parental recombinants were deduced to be NCLB resistance (R). A P-value > 0.05 indicates that no significant difference in DLA between heterozygous and homozygous offsprings, suggesting the absence of Ht3L in the donor region, and the corresponding recombinants were deduced to be NCLB susceptibility (S). Ht3L was narrowed from an ∼11.23-Mb to an ∼577-kb region flanked by the markers KA002081 and KA002084 through five rounds of fine-mapping process. (A) Ht3L was initially mapped in bin 8.06 with the physical distance of 11.23-Mb and fine-mapped to an ∼2.17-Mb interval with seven BC4F1 recombinants. (B) Ht3L was localized into either A007452/KA002076 or KA002081/KA002085 intervals by using six BC6F1 recombinants. (C) Ht3L was confirmed to be located into the 838-kb KA002081/KA002085 interval by using seven BC8F1 recombinants. (D) Ht3L was narrowed down to a 577-kb interval flanked by markers KA002081 and KA002084 by using seven BC10F1 recombinants. (E) Ht3L was further confirmed to be in a 577-kb interval by using three pairs of NILs.

