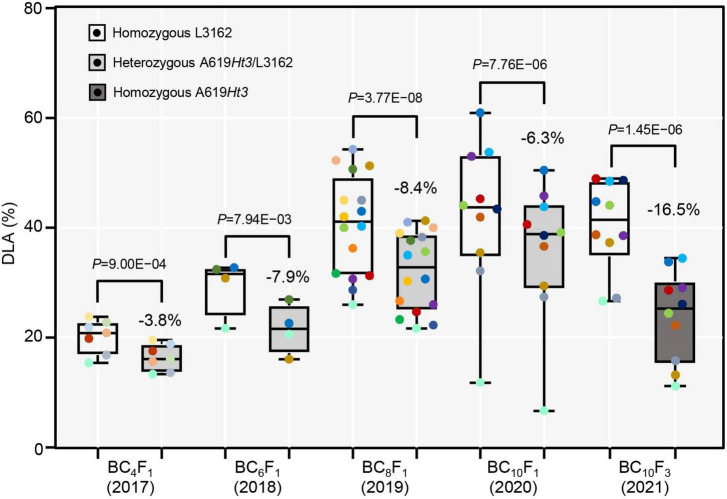
FIGURE 4.
The genetic effect of the Ht3L locus. The DLAs are shown for both homozygous and heterozygous genotypes at Ht3L in the BC4F1, BC6F1, BC8F1, BC10F1 populations. The difference in DLA homozygous ht3l/ht3l and heterozygous Ht3L/ht3l genotypes was calculated for each generation. In the last two columns, the DLAs were calculated for two homozygous genotypes ht3l/ht3l and Ht3L/Ht3L of NIL-I and NIL-II. The P values between two genotypes were calculated by paired two-tailed t-test and indicated. P-value < 0.05 indicates significant difference; P-value > 0.05 indicates no significant difference.

