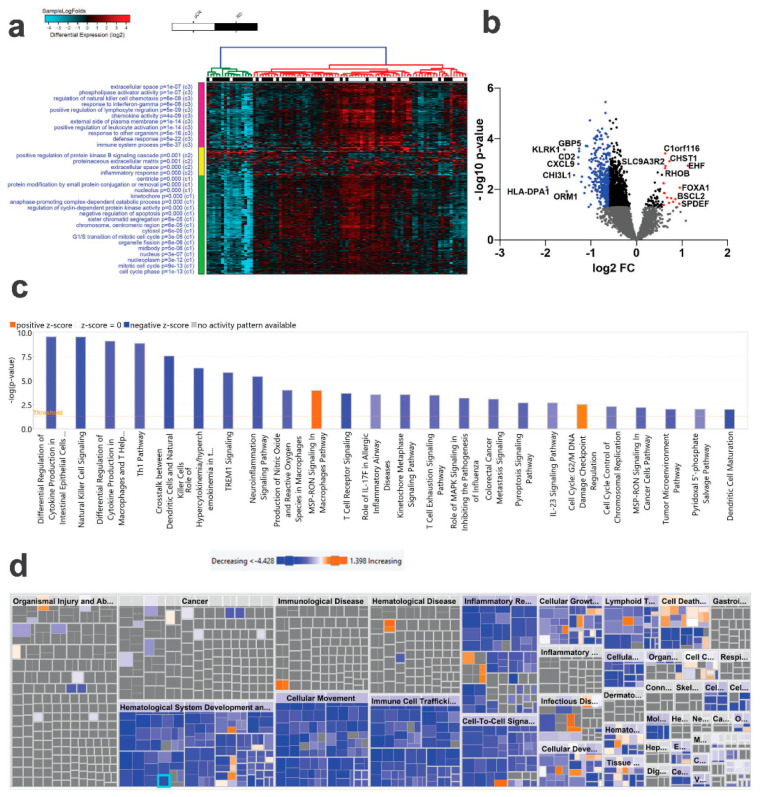
Figure 1.
Comparative analysis of mRNA expression in TNBC patients as a function of pathological complete response (pCR). TNBC patients were grouped according to pCR (n = 38) and residual disease (RD, n = 62) and were subjected to differential analysis (1.5 FC, p< 0.05). (a) Hierarchical clustering of TNBC as a function of pCR (n = 38) or RD (n = 62) based on differentially expressed mRNA genes. Each column represents one patient sample, and each row represents an mRNA. The expression level of each gene (log2) in a single sample is shown according to the color scale. (b) Volcano plot illustrating the upregulated (red) or downregulated (blue) genes in RD vs. pCR TNBC. The most differentially expressed mRNAs are indicated on the plot. (c) IPA canonical pathway analysis on the differentially expressed genes in RD vs. pCR. (d) IPA disease and function analysis of differentially expressed genes in RD vs. pCR. Orange color indicate activation while blue color indicates suppression.

