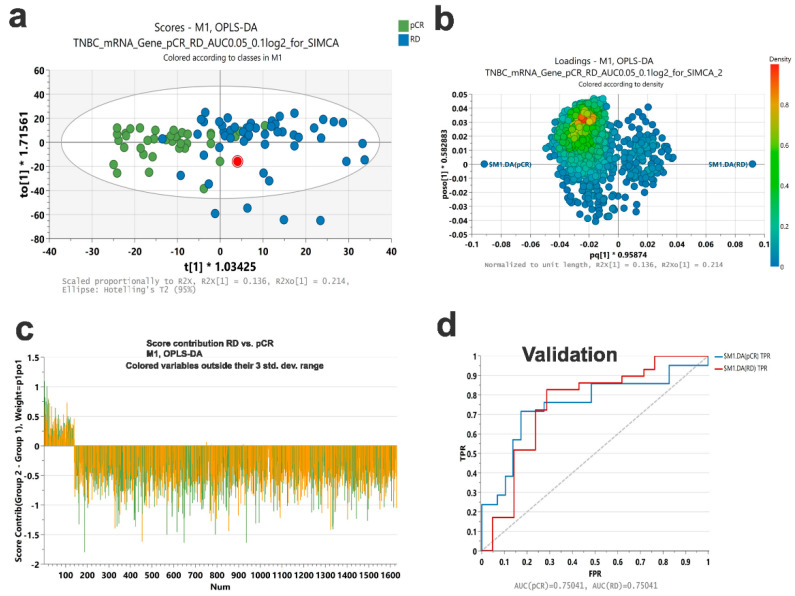
Figure 5.
Validation of a gene signature predictive of RD and pCR in TNBC. (a) OPLS-DA score plot of a RD and pCR gene signature based on ROC analysis. (b) Loading plot based on SIMCA OPLS-DA analysis. Variables are colored according to their density score. (c) Score contribution plot illustrating the contribution of each variable in the model. (d) ROC analysis of the identified gene signature predictive of RD and pCR in an independent validation cohort consisting of 29 RD and 21 pCR. The y-axis represents FPR while the x-axis represents TPR.

