
Fig. 3.
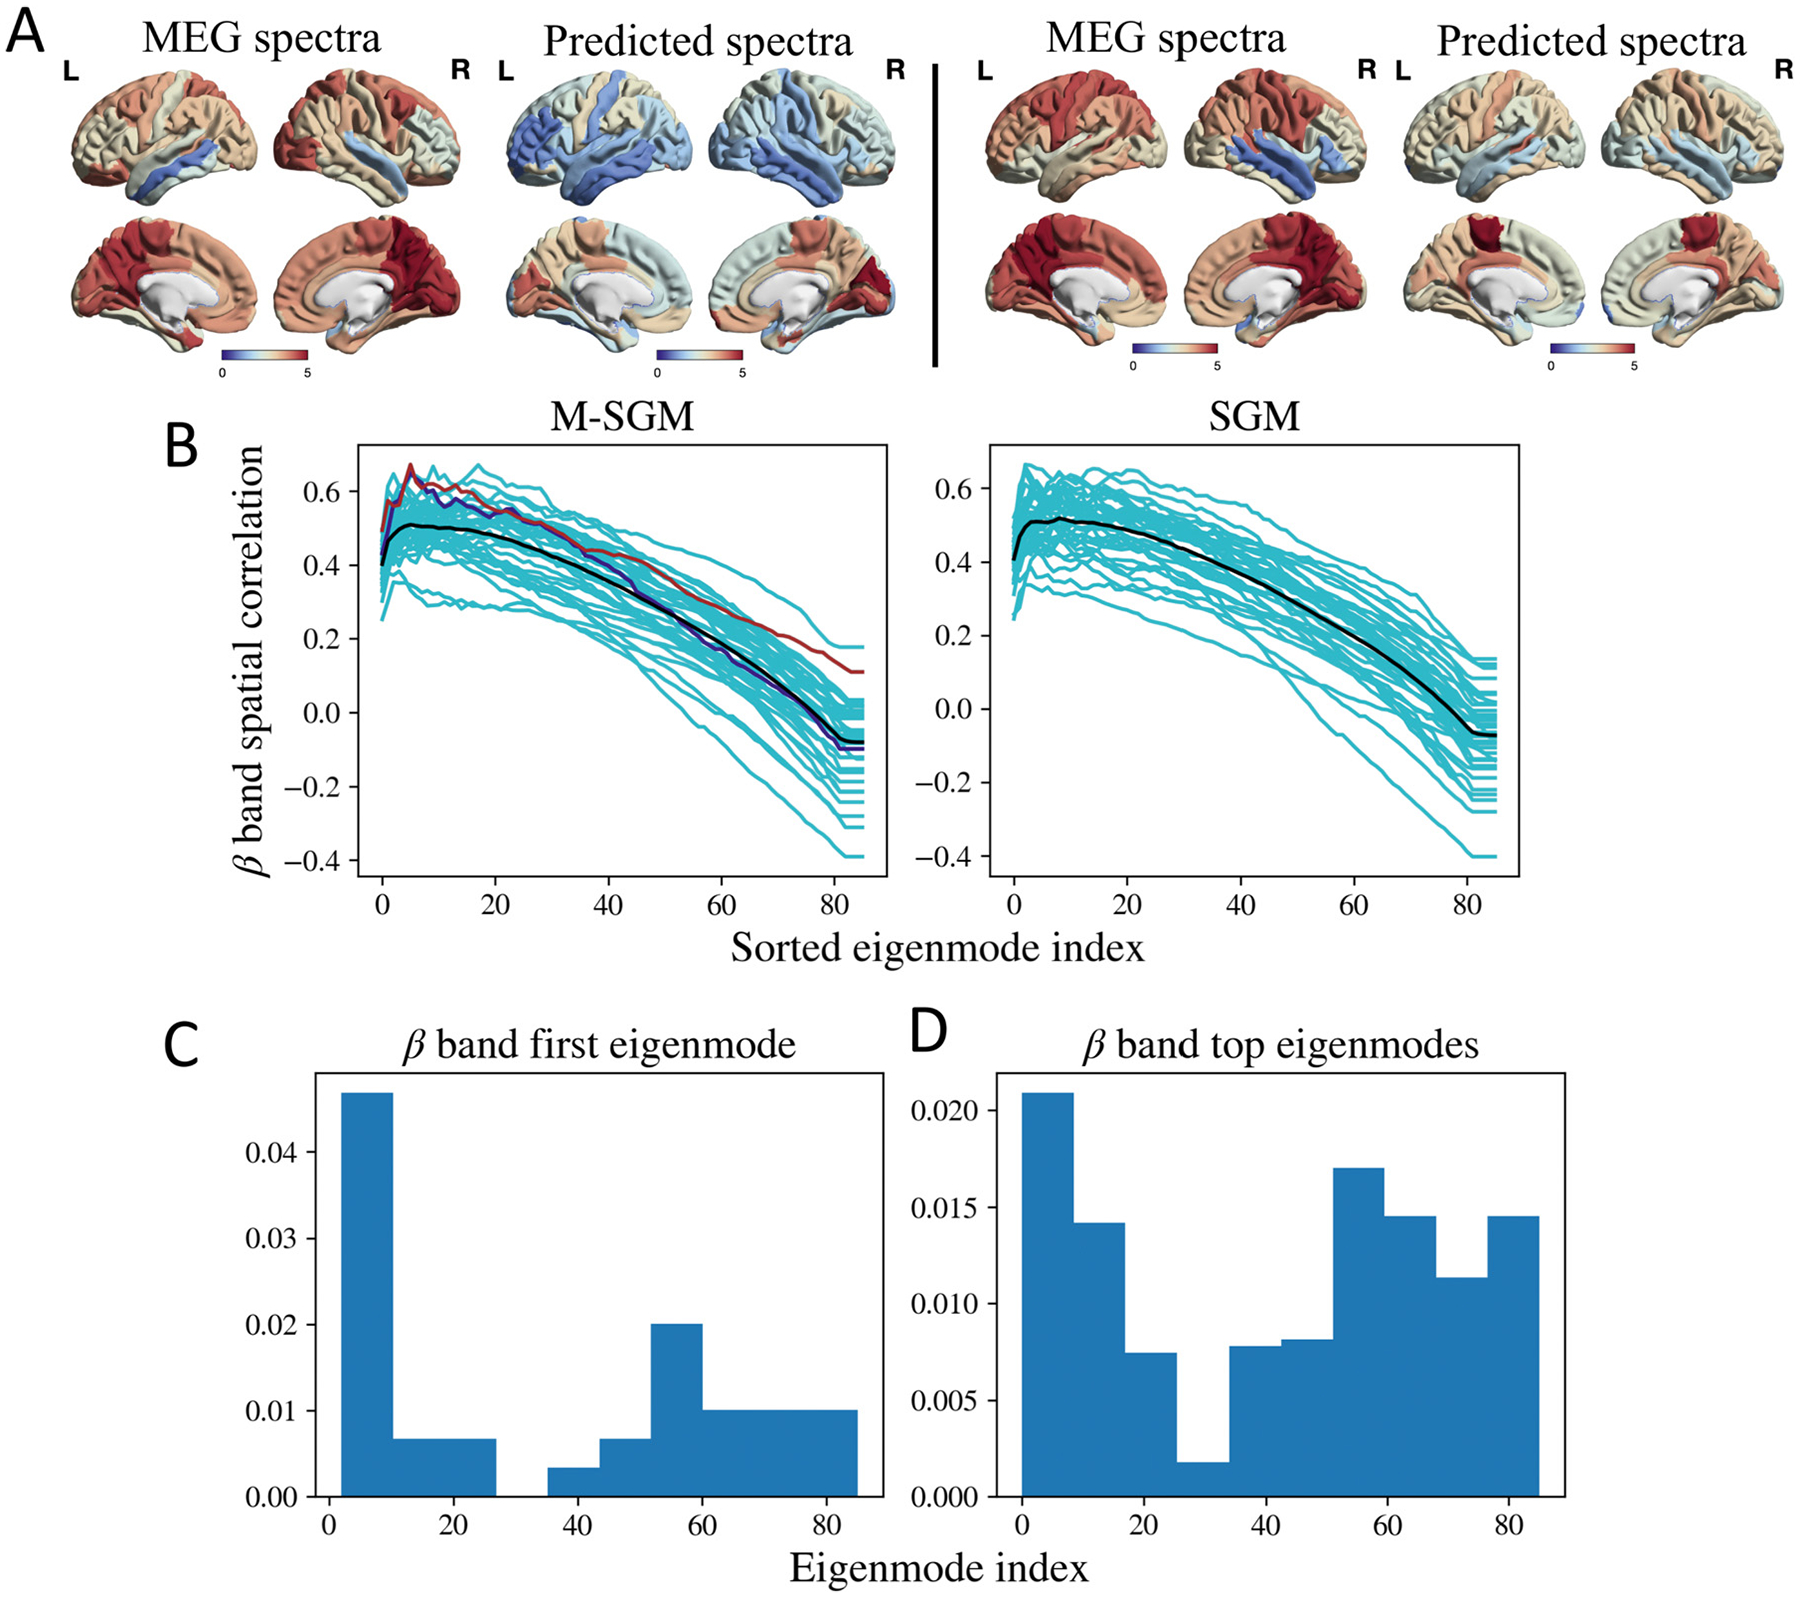
A: Left: MEG spectra and sum of top eigenmodes in the beta band for a specific subject, shaded in blue in B. The Pearson’s r was 0.65. Right: MEG spectra and sum of top eigenmodes for a different subject, shaded in brown in B. The Pearson’s r was 0.67. B: Spatial correlations for beta frequency band. The cyan lines correspond to subject-specific spatial correlations obtained as more eigenmodes are added. The black line corresponds to the average of the spatial correlations. The blue and brown lines correspond to two subjects whose spatial distribution has been demonstrated in A. P-value based on a one-sided paired t-test of the maximum Pearson’s r between M-SGM and SGM gave p = 0.873. The maximum Pearson’s r of M-SGM is statistically not different from that of SGM for the beta band. C: Histogram of first eigenmode with maximum spatial correlation with the beta frequency band. D: Histogram of the top eigenmodes whose summation leads to maximum spatial correlation with the beta frequency band. Brain surface renderings were generated using BrainNet Viewer (Xia et al., 2013) in MATLAB (The Mathworks, 2020).