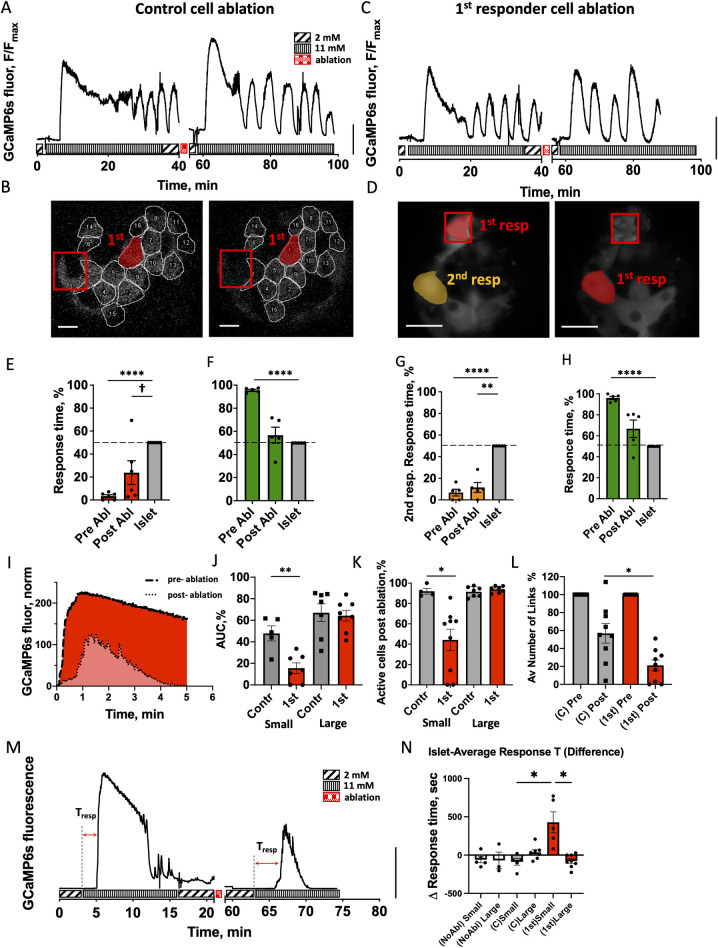
Fig 3. Role of first responder cells.
(A) Representative time course of [Ca2+] dynamics within an islet pre- and post-ablation of a control cell (non-first responder cell). Vertical scale indicates 30% fluorescence intensity change. (B) Representative image of the islet with the location of first responders (red) pre- and post-ablation of a control cell (red square). (C) As in (A) for ablation of first responder cell. (D) As in (B) for ablation of first responder cell (red square), with second responder cell highlighted (orange). (E) Time of response of cells identified as first responders prior to control cell ablation and following control cell ablation (n = 6 islets from 6 mice). (F) As in (E) for last responders. (G) Time of response of cells identified as second responders prior to first responder cell ablation and following first responder cell ablation (n = 5 islets from 5 mice). (H) As in (G) for last responders. (I) Representative time course of Ca2+ elevation following glucose elevation pre- and post-ablation, with the AUC indicated. (J) AUC for the first-phase [Ca2+] response post-ablation of a control and first responder cells, for small (<89 μm diameter) and large (>89 μm diameter) islets. Data are normalized to the AUC prior to ablation. (27 islets from 17 mice) (K) The % of cells that show [Ca2+] elevation post-ablation of a control and first responder cells, for small and large islets. Data are normalized to the AUC prior to ablation. (L) Average number of functional links per islet during the first phase of [Ca2+] response for a control and first responder cell ablations, for small and large islets combined. Data are normalized to the number of functional links prior to ablation (n = 9 islets for each group). Functional network analysis was performed via Pearson-product algorithm, as described before [21]. (M) Representative [Ca2+] pre- and post-first responder ablation in a small islet, Tresp indicates islet-average response time. (N) Response time change in case of no ablation (white bars), control cell ablation (gray bars), or first responder cell ablation (red bars) (35 islets from 20 mice). Two small islets that underwent first responder cell ablation did not respond at all following ablation and were excluded from analysis due to “infinite” response time post-ablation. Statistical analysis in E, F, G, H utilized 1-sample t test (with the null hypothesis of pre- or post-difference from the islet being 0), where **** represents p < 0.0001, *** p < 0.001, ** p < 0.01, * p < 0.05 indicated for comparison of the groups. † in (E) indicates significance of p = 0.06. In I, J, K, L utilized ANOVA with multiple comparison Kruskal–Wallis test, where * p < 0.0332 comparing the groups indicated. See S3 Data file for values used in each graph. AUC, area under the curve.

