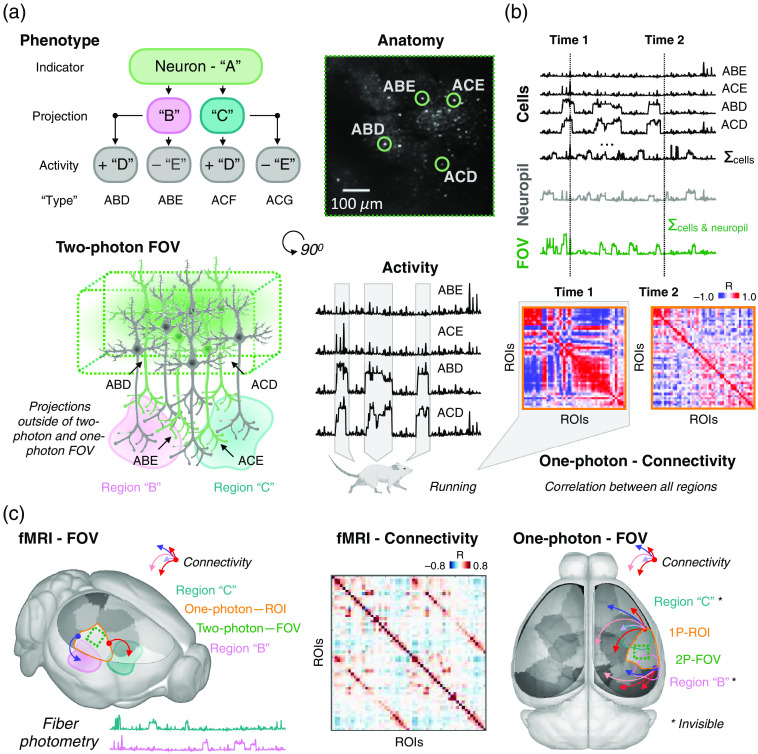
Fig. 3.
Linking across spatiotemporal scales—from (sub)cellular to the whole-brain—and ultimately to behavior. (a) Each neuron can be classified based on a variety of attributes (top left). In this toy example, neurons are labeled with a fluorescent indicator “A.” To further define neurons of “type-A,” they can be grouped by whether they project to two remote brain regions: “B” and “C.” Further, neurons of type-A (that project to region B or C) may (+) or may not (−) exhibit modulated activity during animal locomotion. Together, these three attributes (fluorescence, projection, and modulation with locomotion) can define the phenotype of a cell. To access these attributes can require more than one imaging mode (bottom left) and an understanding of how behavior modulates activity (bottom right). In our example, regions B and C may be deeper in the brain than one- or two-photon imaging can access. The activity of individual cells within a typical multiphoton microscope FOV (top right) sums to approximate coarser measures (b). Understanding how to translate short- and long-range circuit and network function from cellular to mesoscale concert activity, as well as how these measures (e.g., functional connectivity) reflect behavior, will come with help from simultaneous multimodal implementations. (b) Single-cell measures (top) in a two-photon FOV can be summed to approximate measures accessible by one-photon imaging (bottom). Relationships between cells (two-photon) or regions (one-photon) can be summarized using a correlation (connectivity) matrix; a measure of activity synchrony (or asynchrony) between all region pairs. Connectivity matrices can be computed from different epochs of an experiment. In our example, epochs of locomotion or rest using data from different modes. Extending this understanding to the whole brain (c) will also require the implementation of complementary optical approaches and fMRI. For access to deep brain regions (like B and C), either fMRI or fiber photometry can be implemented; the relative coverage and FOV of the imaging technologies discussed here are summarized in (c) side (left) and top (right) view. Like optical imaging data, fMRI data can be summarized using a connectivity matrix (middle), which can help to translate complementary information across spatiotemporal scales.

