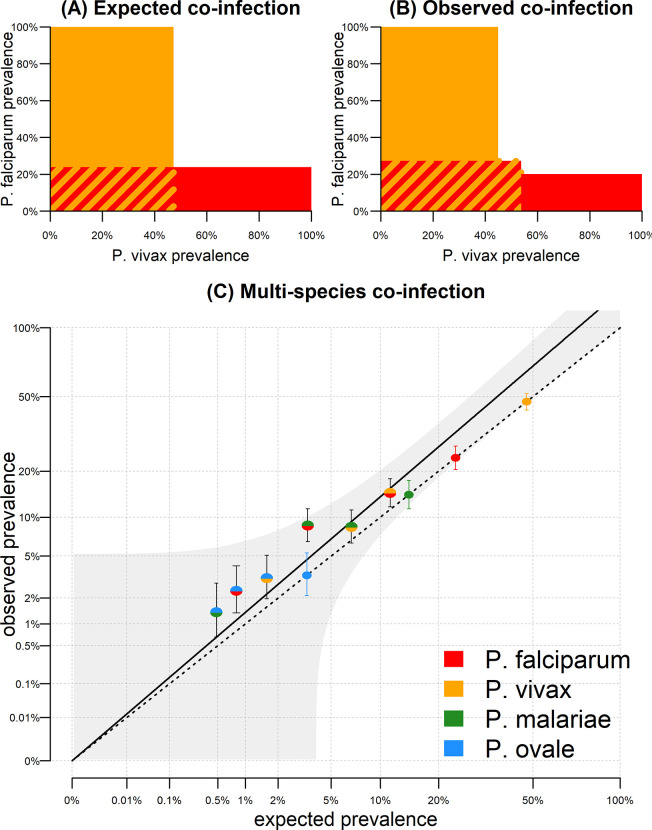
Fig 2. Excess asexual parasite co-infection in pre-treatment samples.
(A) In the pre-treatment samples, Pf asexual prevalence was 23.8% (120/504) and Pv asexual prevalence was 47.4% (239/504). If these parasites were randomly distributed, we would expect co-infection prevalence of 0.238 * 0.474 = 11.3% (red and yellow striped region). (B) Co-infection prevalence of 14.7% (74/504) was observed, in excess of what is expected by random mixing. (C) Expected versus observed co-infection prevalence for the six pairwise combinations of asexual parasites. The dashed line represents the scenario where observed co-infection prevalence equals expected prevalence. Mono-coloured points denote observed prevalence rates of the four species. The multi-coloured data points fall above this line. The solid line denotes a regression model fitted through these points, with 95% confidence intervals shown in grey.

