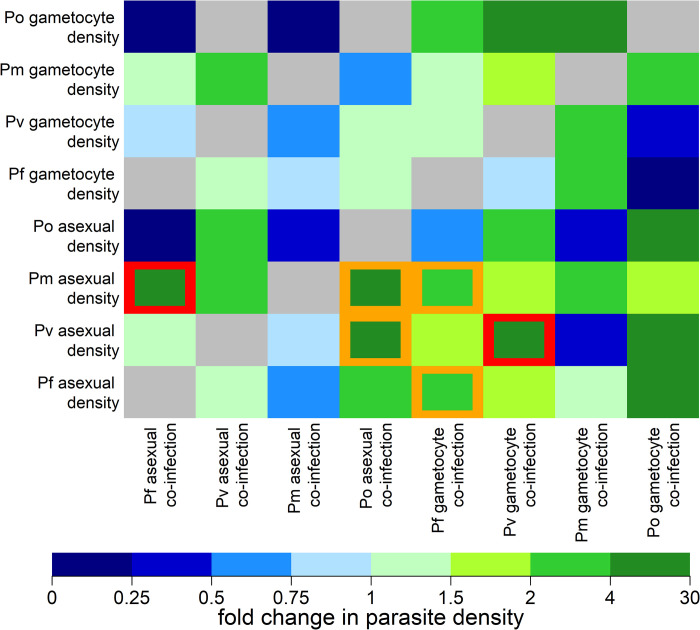
Fig 4. Effect of co-infection on parasite density in pre-treatment samples.
The y-axis denotes the measured parasite density and the x-axis denotes the confounding effect of co-infection. Each square denotes the fold change in parasite density due to co-infection. For example, for Pm asexual parasites, co-infection with Pf asexual parasites leads to a 6.57 (2.9, 14.8) fold increase in Pm asexual parasite density. Grey squares denote interactions where it was not possible to estimate an effect. Otherwise, all estimated effects are presented regardless of statistical significance. Orange squares denote significant associations with P values < 0.05. Red squares denote significant associations with P values < 0.05 after the Benjamini-Hochberg adjustment for multiple hypothesis testing.

