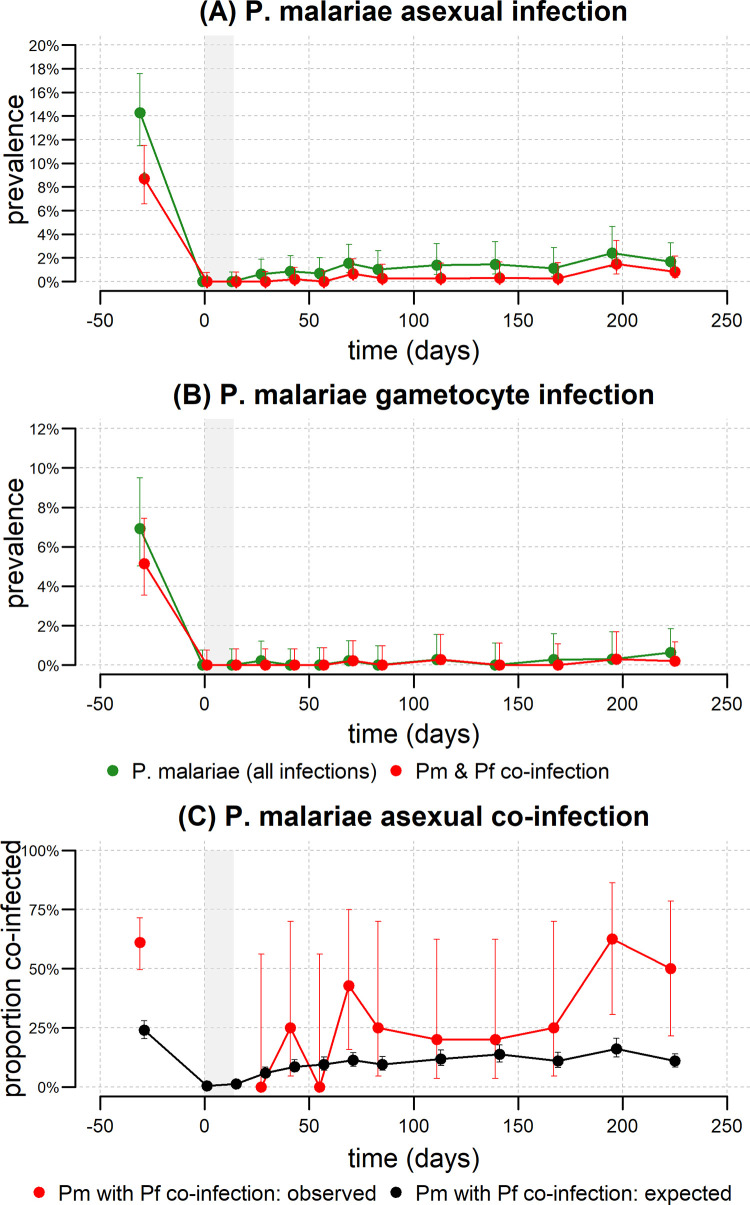
Fig 5. Longitudinal analysis of P. malariae and the effect of co-infection.
The prevalence of (A) P. malariae asexual parasites, and (B) P. malariae gametocytes. The prevalence of all P. malariae infections is shown in green, and the prevalence of P. malariae and P. falciparum co-infection is shown in red. The grey shaded region denotes the period of treatment. 5561 samples were included over the entire time period. 123 samples were positive for P. malariae asexual parasites, and 61 of these were co-infected with P. falciparum asexual parasites. 43 samples were positive for P. malariae gametocytes, and 18 of these were co-infected with P. falciparum gametocytes. (C) The observed proportion of P. malariae asexual infections that are co-infected with P. falciparum is shown in red. The expected proportion of P. malariae infections co-infected with P. falciparum under an assumption of random mixing is shown in black.

