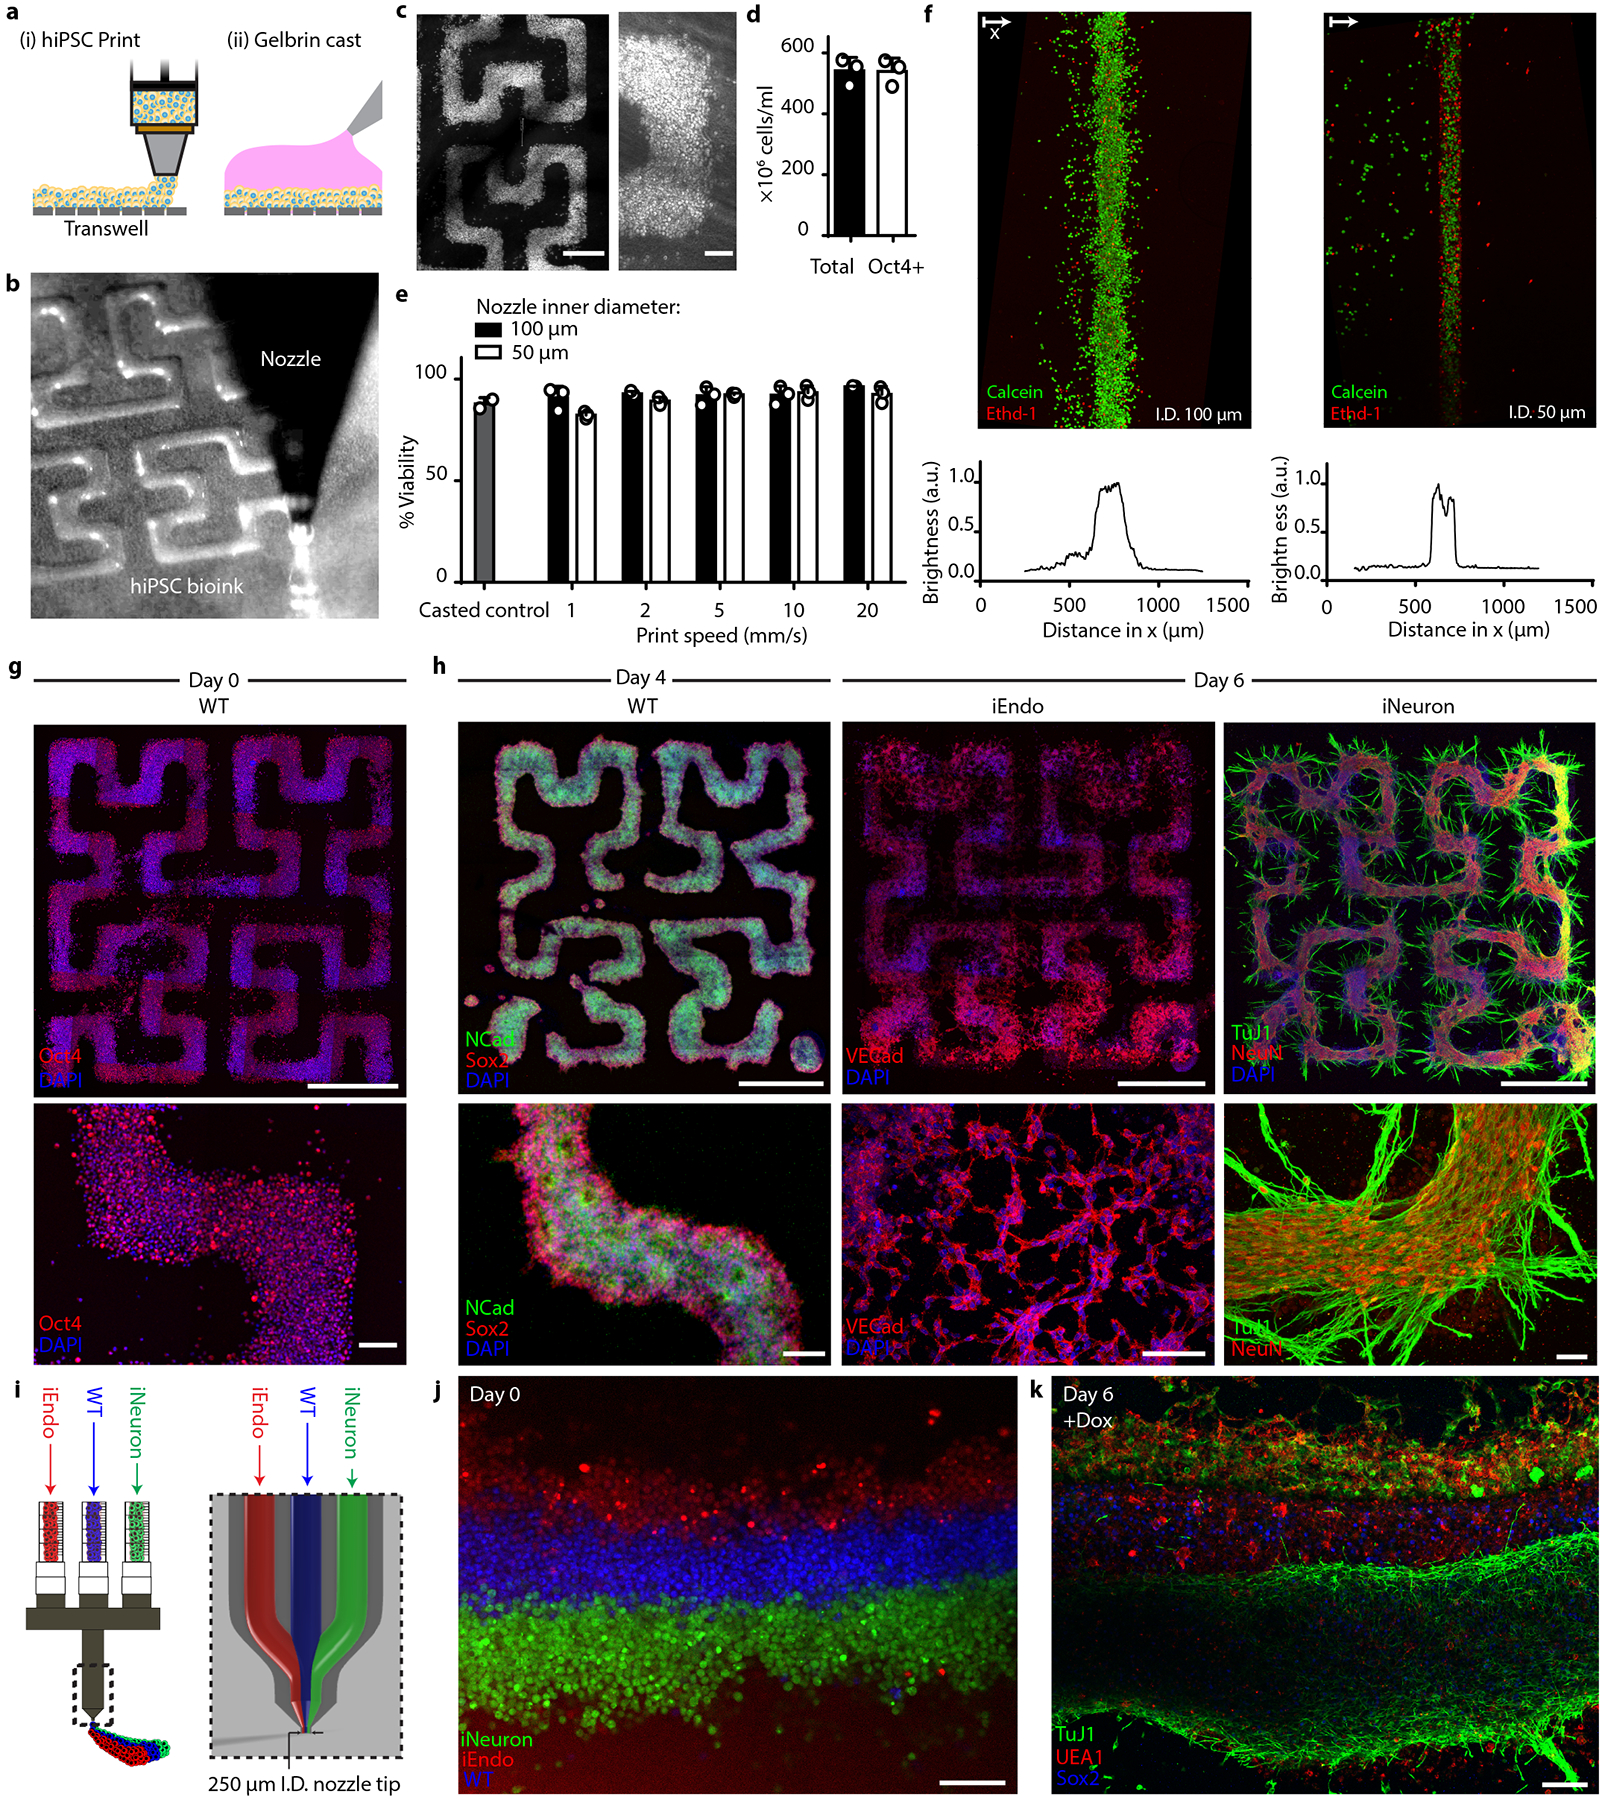
Fig. 5 |. Multicellular neural tissues via 3D bioprinting coupled with OiD.

a, Schematic of the bioprinting and gel casting process. b, Image of bioink extrusion through the 50 μm nozzle during the bioprinting process. c, Brightfield images of bioprinted filamentary features. Left: overview image of the printed pattern. right: closeup image of the cell-dense printed pattern. d, Total cell number and flow cytometry quantification of Oct4+ cells within bioprinted filaments immediately after printing. Data represent mean ± s.d. (n = 3, from 3 independent cell ink batches). e, hiPSC viability within bioprinted filaments at different speeds and casted (control) samples, as measured using calcein-AM/ethidium homodimer live/dead assays. Data represent mean ± s.e.m. (n = 3, from 3 independent batches). f, Live/dead staining of bioprinted filaments produced using nozzle diameters of 100 μm (top, left) and 50 μm (top, right) and the corresponding distributions (bottom) of their fluorescence intensity. g, Immunostaining of Oct4 in patterns fixed on day 0, immediately after printing. h, Bioprinted tissue architectures cultured in NIM. Top: overview images of printed patterns. Bottom: close-up images of hiPSC differentiation. Left: immunostaining of NCAD and SOX2 for WT printed patterns at day 4. Middle: immunostaining of VEcad for iEndo printed patterns at day 6. right: immunostaining of Tuj1 and NeuN of iNeuron printed patterns at day 6. i, Design of tri-material nozzle for multimaterial bioprinting. j, Fluorescence image of bioprinted CellTracker-labelled WT, iEndo and iNeuron inks. k, Immunostaining of Tuj1, UEA1 and SOX2 of 3D-printed multicellular tissues at day 6. Scale bars: 1000 μm in g (top) and h (top); 500 μm in c (left); 100 μm in c (right), g (bottom) and h (bottom), j and k.
