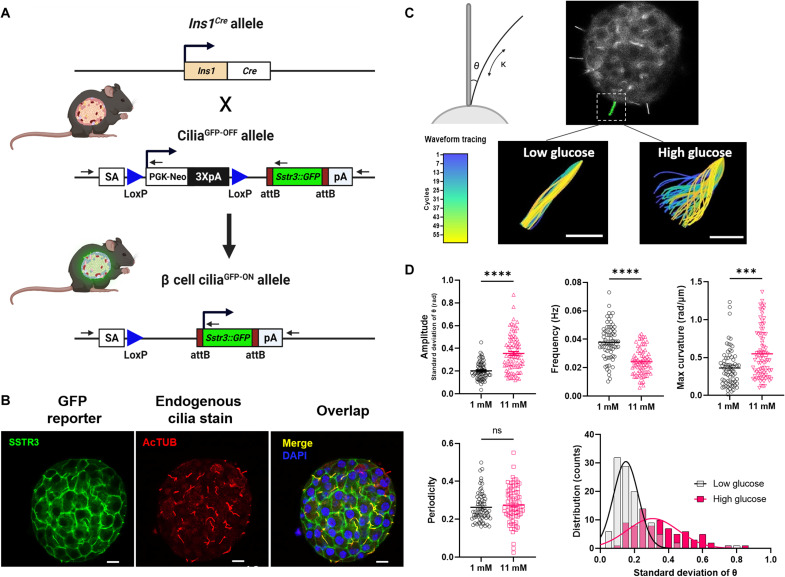
Fig. 2. Beta cell cilia exhibit glucose-dependent motility.
(A) Beta cell cilia reporter mice were generated by crossing INS1-Cre with SSTR3-GFPOFF strains. (B) SSTR3-GFP protein is enriched in beta cell cilia with detectable expression also in the plasma membrane. Colocalization of SSTR3 fluorescence reporter (green) with antibody-stained acetylated alpha tubulin (cilia marker, red) is seen as yellow in the merged image. Non–beta cell cilia are red only. Nuclei are labeled in DAPI (blue). Scale bar, 10 μm. (C) Beta cell cilia exhibit glucose-dependent motility. Schematic shows measurement of theta (θ) as the angle of deflection and kappa (κ) as the curvature of the cilia axoneme. Video microscopy captures primary cilia movement on murine beta cells in response to glucose (movie S2), with representative traces shown in colored panels corresponding to the temporal heatmap where the starting frame of the ciliary wave is depicted in blue and the end in yellow. Scale bar, 5 μm. (D) Cilia waveform analysis showing increased ciliary curvature, reduced frequency, and increased amplitude at high glucose (movie S2); n = 80 per condition. ***P < 0.001 and ****P < 0.0001. Histogram shows cilia amplitude distribution at 1 mM low glucose (black) versus 11 mM high glucose (magenta).

