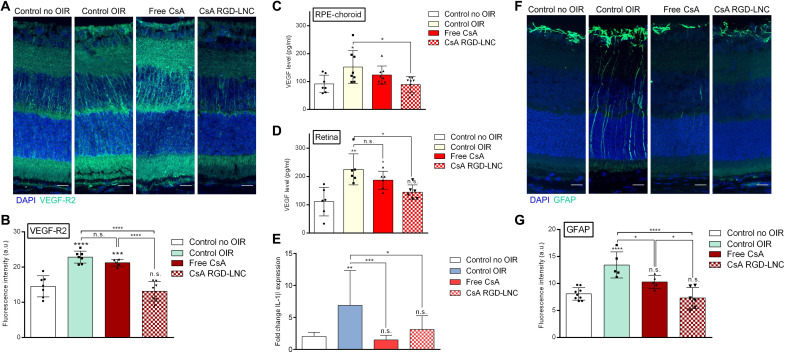
Fig. 5. Molecular angiogenic and inflammatory responses to CsA RGD-LNC therapy.
(A) Imaging of VEGF-R2 expression in the posterior eye. Blue, DAPI staining of cell nuclei; green, VEGF-R2. (B) Quantitative analysis of VEGF-R2 fluorescence density from cryosections immunohistochemically stained with VEGF-R2 antibody (A). (C and D) Assessment of VEGF protein levels in (C) the RPE-choroid complex and (D) the neural retina determined through ELISA. (E) Quantification of IL-1β mRNA expression levels in RPE-choroid complex using reverse transcription quantitative polymerase chain reaction (RT-qPCR). (F) Imaging of GFAP expression in the posterior eye. Blue, DAPI staining of cell nuclei; green, GFAP. (G) Quantitative analysis of GFAP fluorescence from sections shown in (F). Scale bars, 20 μm. Results are presented as means ± SD of at least n = 5 (A, B, and E to G) and n = 6 (C and D) mice per treatment group. Levels of statistical significance are indicated as *P ≤ 0.05, **P ≤ 0.01, ***P ≤ 0.001, and ****P ≤ 0.0001. P values were determined by one-way ANOVA (A to F).

