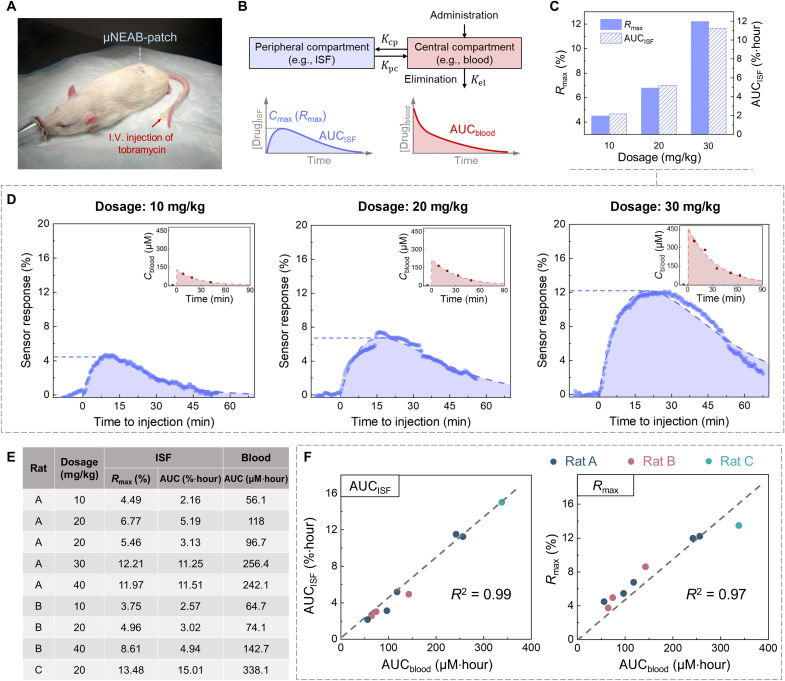
Fig. 4. In vivo ISF correlation studies enabled by the μNEAB-patch.
(A) Photo of the animal study setup. The μNEAB-patch was applied at the back of the rat, and the drug was injected intravenously from the tail vein with the aid of a catheter. (B) Schematics of a two-compartment PK model and representative PK profiles in central and peripheral compartments. Kpc, Kcp, and Kel denote the first-order rate constants for distribution, redistribution, and elimination, respectively. (C) ISF PK parameters of one animal (rat A) with three different tobramycin doses. (D) The measured and baseline-corrected μNEAB-patch readouts of (C). Insets show the corresponding blood measurements. Dash lines show the fitted PK curves. (E) Tabulated PK results among three animals (nine trials). (F) Correlations between PK parameters in ISF and blood. Left: AUCblood versus AUCISF; right: AUCblood versus Rmax.

