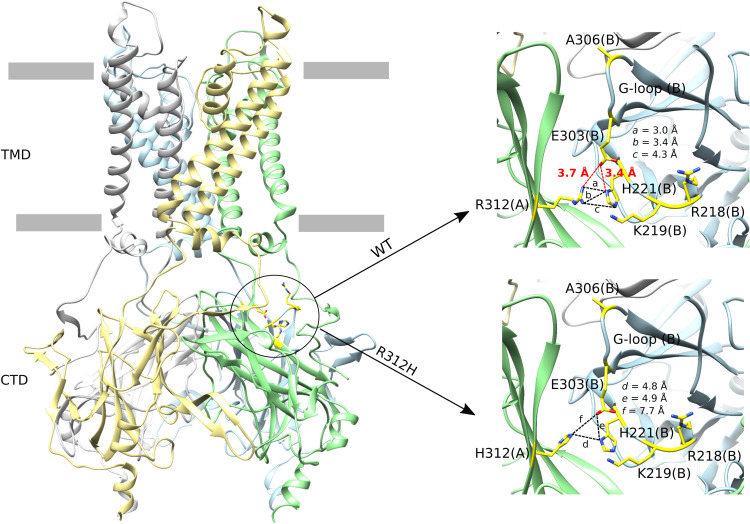
Fig. 5. Interaction network between R312, H221, and E303 residues in the human Kir2.1 channel cryo-EM structure.
Cartoon representation of the human Kir2.1 channel cryo-EM structure highlighting (inside the circle) the location of the R312 residue. The insets show the intersubunit interaction network of R312 in the WT (top) and that of H312 in the R312H mutant (bottom) between chains A and B. The chains A, B, C, and D are shown in green, blue, gray, and yellow, respectively. Residues R218, K219, H221, E303, and A306 are represented as yellow sticks. The chains are indicated in parenthesis. Salt bridge distances are highlighted in red dashes and the other distances are highlighted in black dashes.

