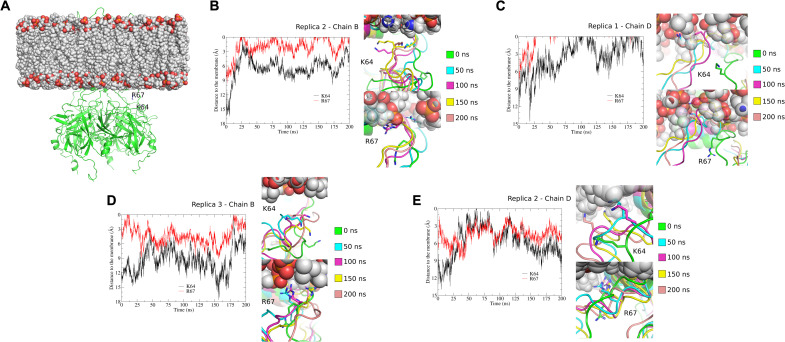
Fig. 8. Tethering of K64 and R67 to the membrane displayed in MD simulations.
(A) Human Kir2.1 cryo-EM structure and membrane (POPC bilayer) system used in MD simulations. The Kir2.1 channel structure is represented in a green cartoon, and the residues K64 and R67 of chain B are highlighted. (B to E) Trajectory analysis of the K64 and R67 residues along the 200 ns of MD simulations in some representative chains of the three replicates. In each of these panels, snapshots along MD simulations are shown: 0 ns (green), 50 ns (cyan), 100 ns (magenta), 150 ns (yellow), and 200 ns (salmon). K64 and R67 residues are highlighted in sticks. (B) to (E) show the distances between the K64 and R67 residues to the plane of the phosphate groups from the inner membrane. To calculate these distances, the inner membrane was centered at Z = 0. The 0 value represents the membrane level. (B) Chain B, replica 2; (C) chain D, replica 1; (D) chain B, replica 3; (E) chain D, replica 2.

