
Fig. 2.
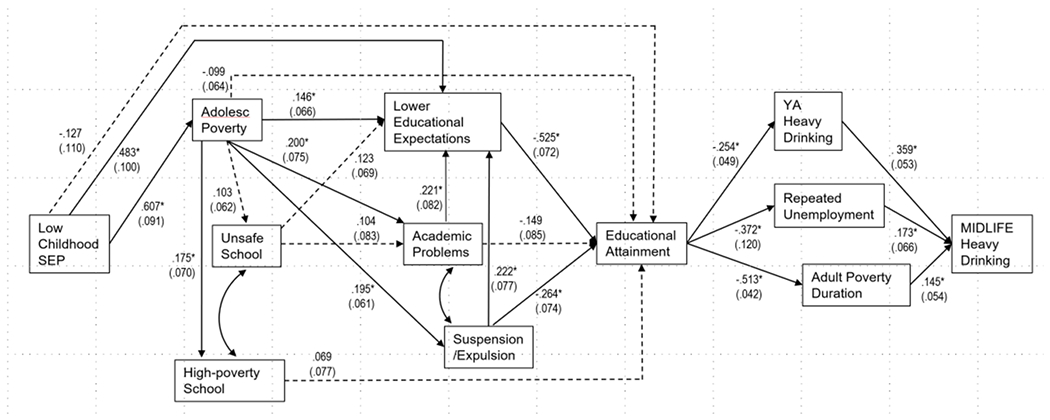
Standardized Estimates for Black American Women
Notes: All modeled standardized direct paths are displayed. Solid lines and * indicate p <.05. Observations = 583 (71 observations were excluded from the final path model due to missing values on either family history of alcohol problems or low childhood SEP), df = 105, CFI = 0.995, TLI = 0.992, RMSEA estimate = 0.008 (p<=.05), R2 midlife heavy drinking (0.223), total effect (β = 0.131, CI= 0.072-0.197).