Figure 4.
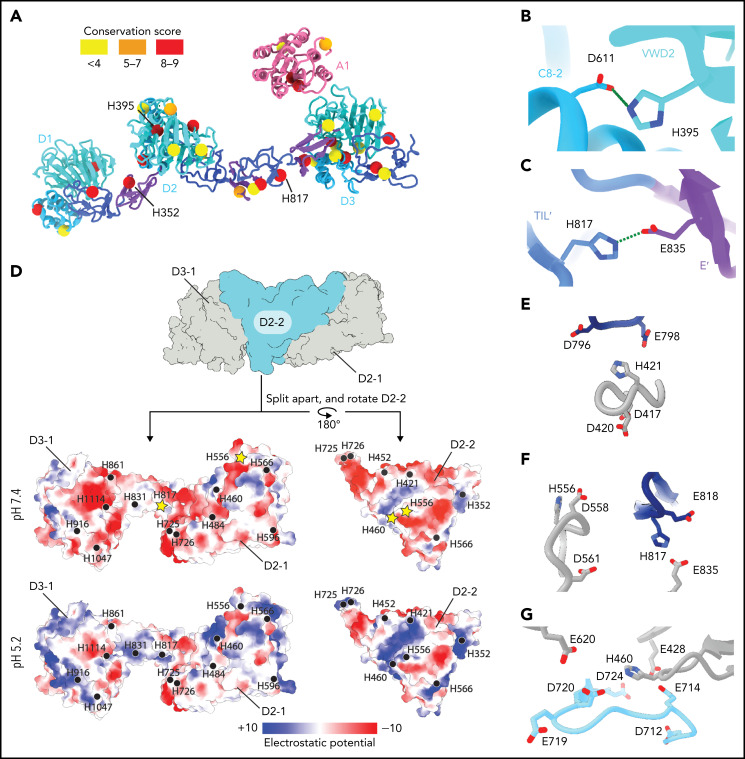
Structural basis for pH-dependent VWF tubule formation. (A) The Cα positions of the 33 histidine residues resolved in the structure are depicted as spheres color-coded based on sequence conservation obtained from 140 homologs using the ConSurf server.47 (B) Details of the intramonomer salt bridge made by H395. (C) Details of the intramonomer salt bridge made by H817. (D) Interface between D2-D3 of one molecule (denoted D2-1 and D3-1; gray) and the D2 domain of another molecule (D2-2; teal) (top). The interfaces are separated and colored by electrostatic potential calculated at pH 7.4 (middle) and 5.2 (bottom). Electrostatic potentials were calculated using default coulombic parameters in ChimeraX 1.3.24 The positions of surface-exposed histidine residues are marked with a black circle or a yellow star if highlighted in panels (E-G). (E-G) Examples of histidine residues—(E) H421, (F) H556 and H817, and (G) H460—that change protonation state upon pH change from 7.4 to 5.2 in electronegative local environments.

