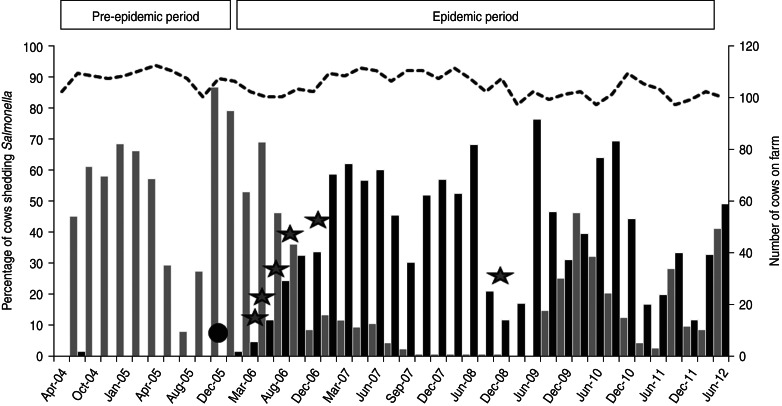
Fig. 1.
Percentage of cows shedding Salmonella enterica on the study farm. Black bars indicate percentage of cows shedding S. Kentucky and grey bars indicate percentage of cows shedding S. Cerro (primary y-axis). Dotted black line shows the number of cows on the farm (secondary y-axis). The black circle indicates initial introduction of the epidemic strain onto the farm. Grey stars indicate introductions of heifers shedding the epidemic strain.

