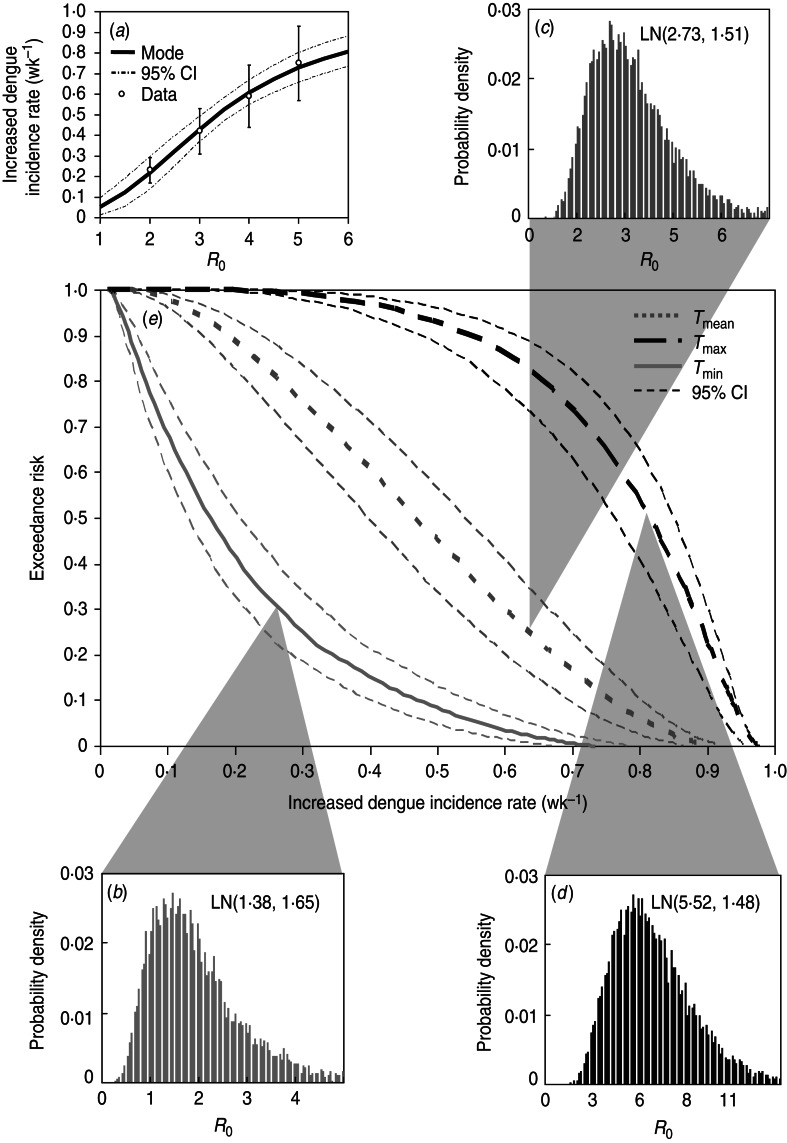
Fig. 5.
(a) Reconstructed dose–response profile describing the relationship between R0 estimates and increased dengue incidence rate (wk−1). (b–d) Temperature regimen-specific R0 distributions described by the lognormal function of LN(geometric mean, geometric standard deviation). (e) Exceedance risk profiles of increased dengue incidence rate (wk−1) estimate based on R0 distributions at Tmin, Tmean, and Tmax.

