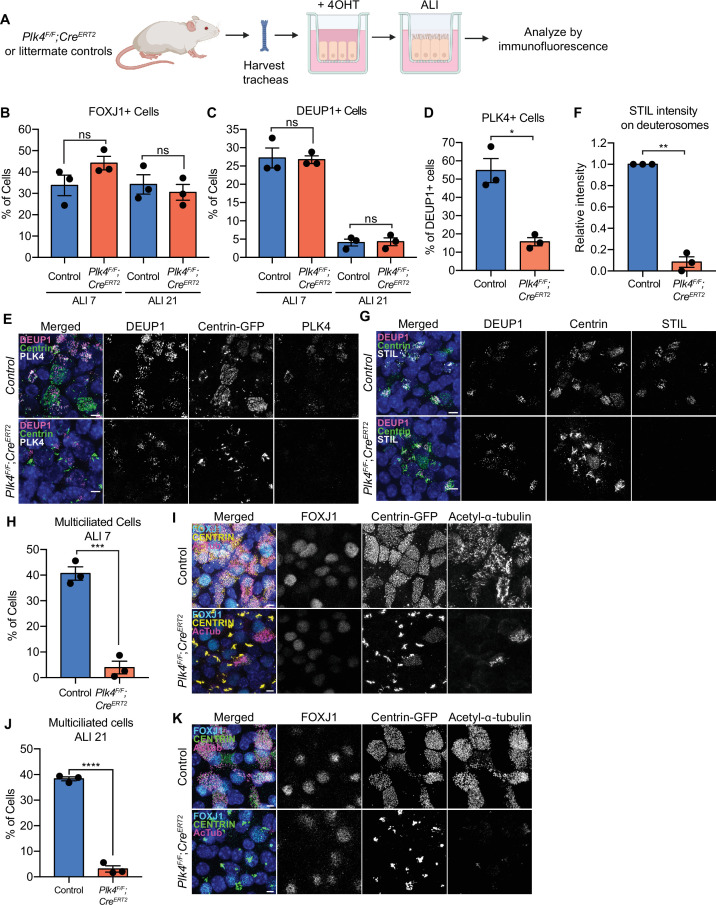
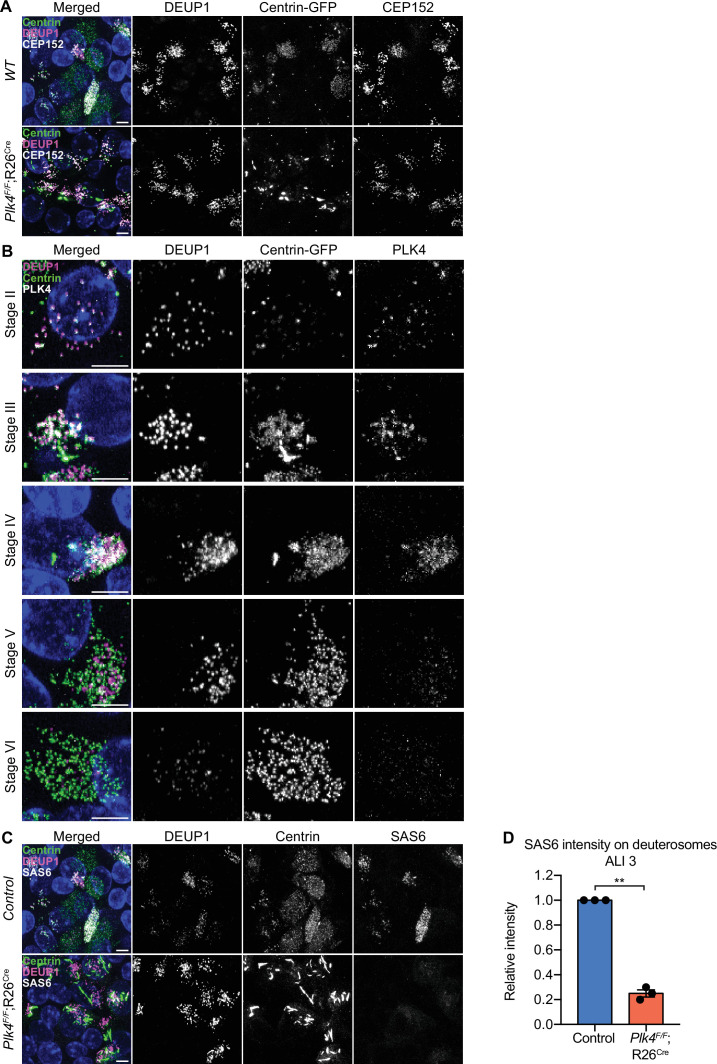
Figure 4. PLK4 promotes centriole assembly in mTECs.
(A) Schematic of the experimental design to genetically deplete PLK4 in mTECs. Plk4F/F;R26Cre tracheal epithelial cells were seeded onto collagen-coated transwell filters and allowed to proliferate until confluence (day 3). At this point, Cre-mediated recombination of the Plk4F/F allele was induced by the addition of 4OHT to the media. After 2 days, mTECs were exposed to ALI to initiate differentiation. (B) Quantification of the percent of control or Plk4F/F;R26Cre mTECs expressing FOXJ1 at ALI 7 and ALI 21. N=3, n>500. Two-tailed Welch’s t-test. (C) Quantification of the percent of control or Plk4F/F;R26Cre mTECs with deuterosomes at ALI 7 and ALI 21. N=3, n>500. Two-tailed Welch’s t-test. (D) Quantification of the percent of control or Plk4F/F;R26Cre mTECs that express PLK4 at ALI 3. N=3, n>500. Two-tailed Welch’s t-test. (E) Confocal images of control and Plk4F/F;R26Cre mTECs at ALI 3. Cells were expressing Centrin-GFP and stained with DEUP1 (magenta) and PLK4 (white). Scale bar=5 μm. (F) Quantification of the intensity of STIL on deuterosomes in control or Plk4F/F;R26Cre mTECs at ALI 3. Cells in all stages of centriole amplification were measured and pooled. N=3, n>500. Two-tailed Welch’s t-test. (G) Confocal images of control and Plk4F/F;R26Cre mTECs at ALI 3. Cells were expressing Centrin-GFP and stained with DEUP1 (magenta) and STIL (white). Scale bar=5 μm. (H) Quantification of multiciliated mTECs at ALI 7. N=3, n>500. Two-tailed Welch’s t-test. (I) Confocal images of control and Plk4F/F;R26Cre mTECs at ALI 7. Cells were expressing Centrin-GFP (yellow) and stained with FOXJ1 (cyan) and acetylated-α-tubulin (magenta). Scale bar=5 μm. (J) Quantification of multiciliated mTECs at ALI 21. N=3, n>500. Two-tailed Welch’s t-test. (K) Confocal images of control and Plk4F/F;R26Cre mTECs at ALI 21. Cells were expressing Centrin-GFP (green) and stained with FOXJ1 (cyan) and acetylated-α-tubulin (magenta). Scale bar=5 μm. Data information: All data represent the means ± SEM. *p<0.05; **<0.01; ***<0.001; ****<0.0001 and not significant indicates p>0.05. ALI, air-liquid interface; mTEC, mouse trachea epithelial cell.


