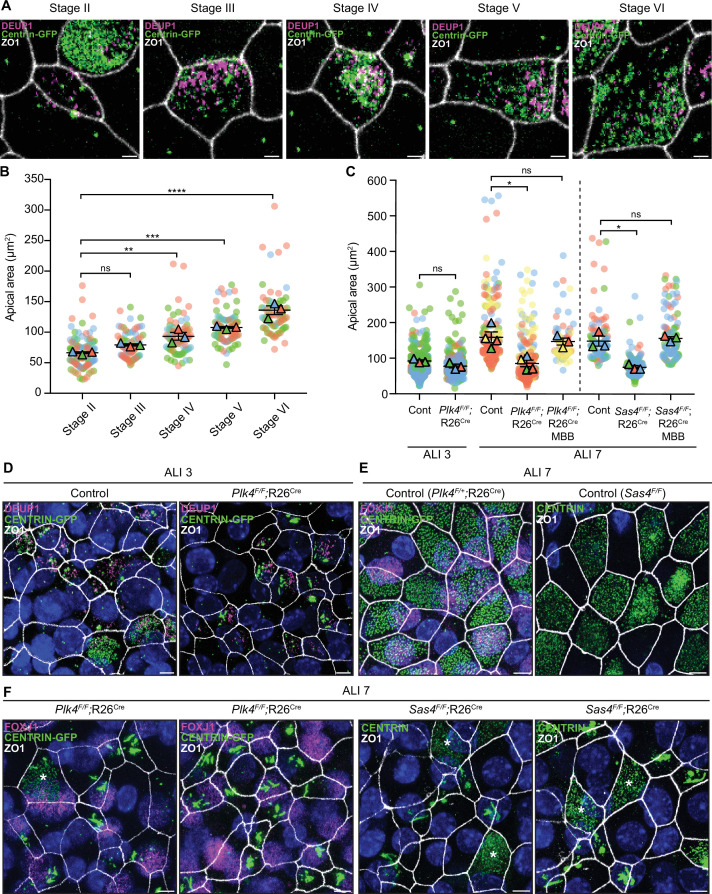
Figure 7. Centriole amplification promotes apical surface area expansion in mTECs.
(A) Representative confocal images of control mTECs in stages II-VI of centriole amplification. Cells were expressing Centrin-GFP and stained with antibodies against DEUP1 (magenta) and ZO1 (white). Scale bar = 2 μm. (B) Graph of the apical area of control mTECs (marked with ZO1) at ALI 3 at different stages of centriole amplification. Circles represent individual cells and triangles represent the average per biological replicate. N=3, n≥20. One-way ANOVA with post hoc analysis. (C) Graph of the apical area of control, Plk4F/F;R26Cre and Sas4F/F;R26Cre mTECs at ALI 3 and ALI 7. The area across all stages of centriole amplification was pooled per condition. MBB phase cells that presumably escaped Cre-mediated recombination serve as an internal control. Circles represent individual cells and triangles represent the average per biological replicate. N≥3, n≥50. Two-tailed Welch’s t-test (ALI 3). One-way ANOVA with post hoc analysis (ALI 7). (D) Representative confocal images of control and Plk4F/F;R26Cre mTECs at ALI 3. Cells were expressing Centrin-GFP and stained with antibodies against DEUP1 (magenta) and ZO1 (white). Scale bar = 5 μm. (E) Representative confocal images of control mTECs at ALI 7. Plk4F/+;R26Cre cells were expressing Centrin-GFP and stained with antibodies against FOXJ1 (magenta) and ZO1 (white). Sas4F/F cells were stained with antibodies against Centrin (green) and ZO1 (white). Scale bar = 5 μm. (F) Representative confocal images of Plk4F/F;R26Cre and Sas4F/F;R26Cre mTECs at ALI 7. Plk4F/F;R26Cre cells were expressing Centrin-GFP and stained with antibodies against FOXJ1 (magenta) and ZO1 (white). Sas4F/F;R26Cre cells were stained with antibodies against Centrin (green) and ZO1 (white). MBB phase cells that presumably escaped Cre-mediated recombination are marked with an *. Scale bar = 5 μm. Data information: All data represent the means ± SEM. *P < 0.05; **< 0.01; ***< 0.001; ****< 0.0001 and not significant indicates P > 0.05.

