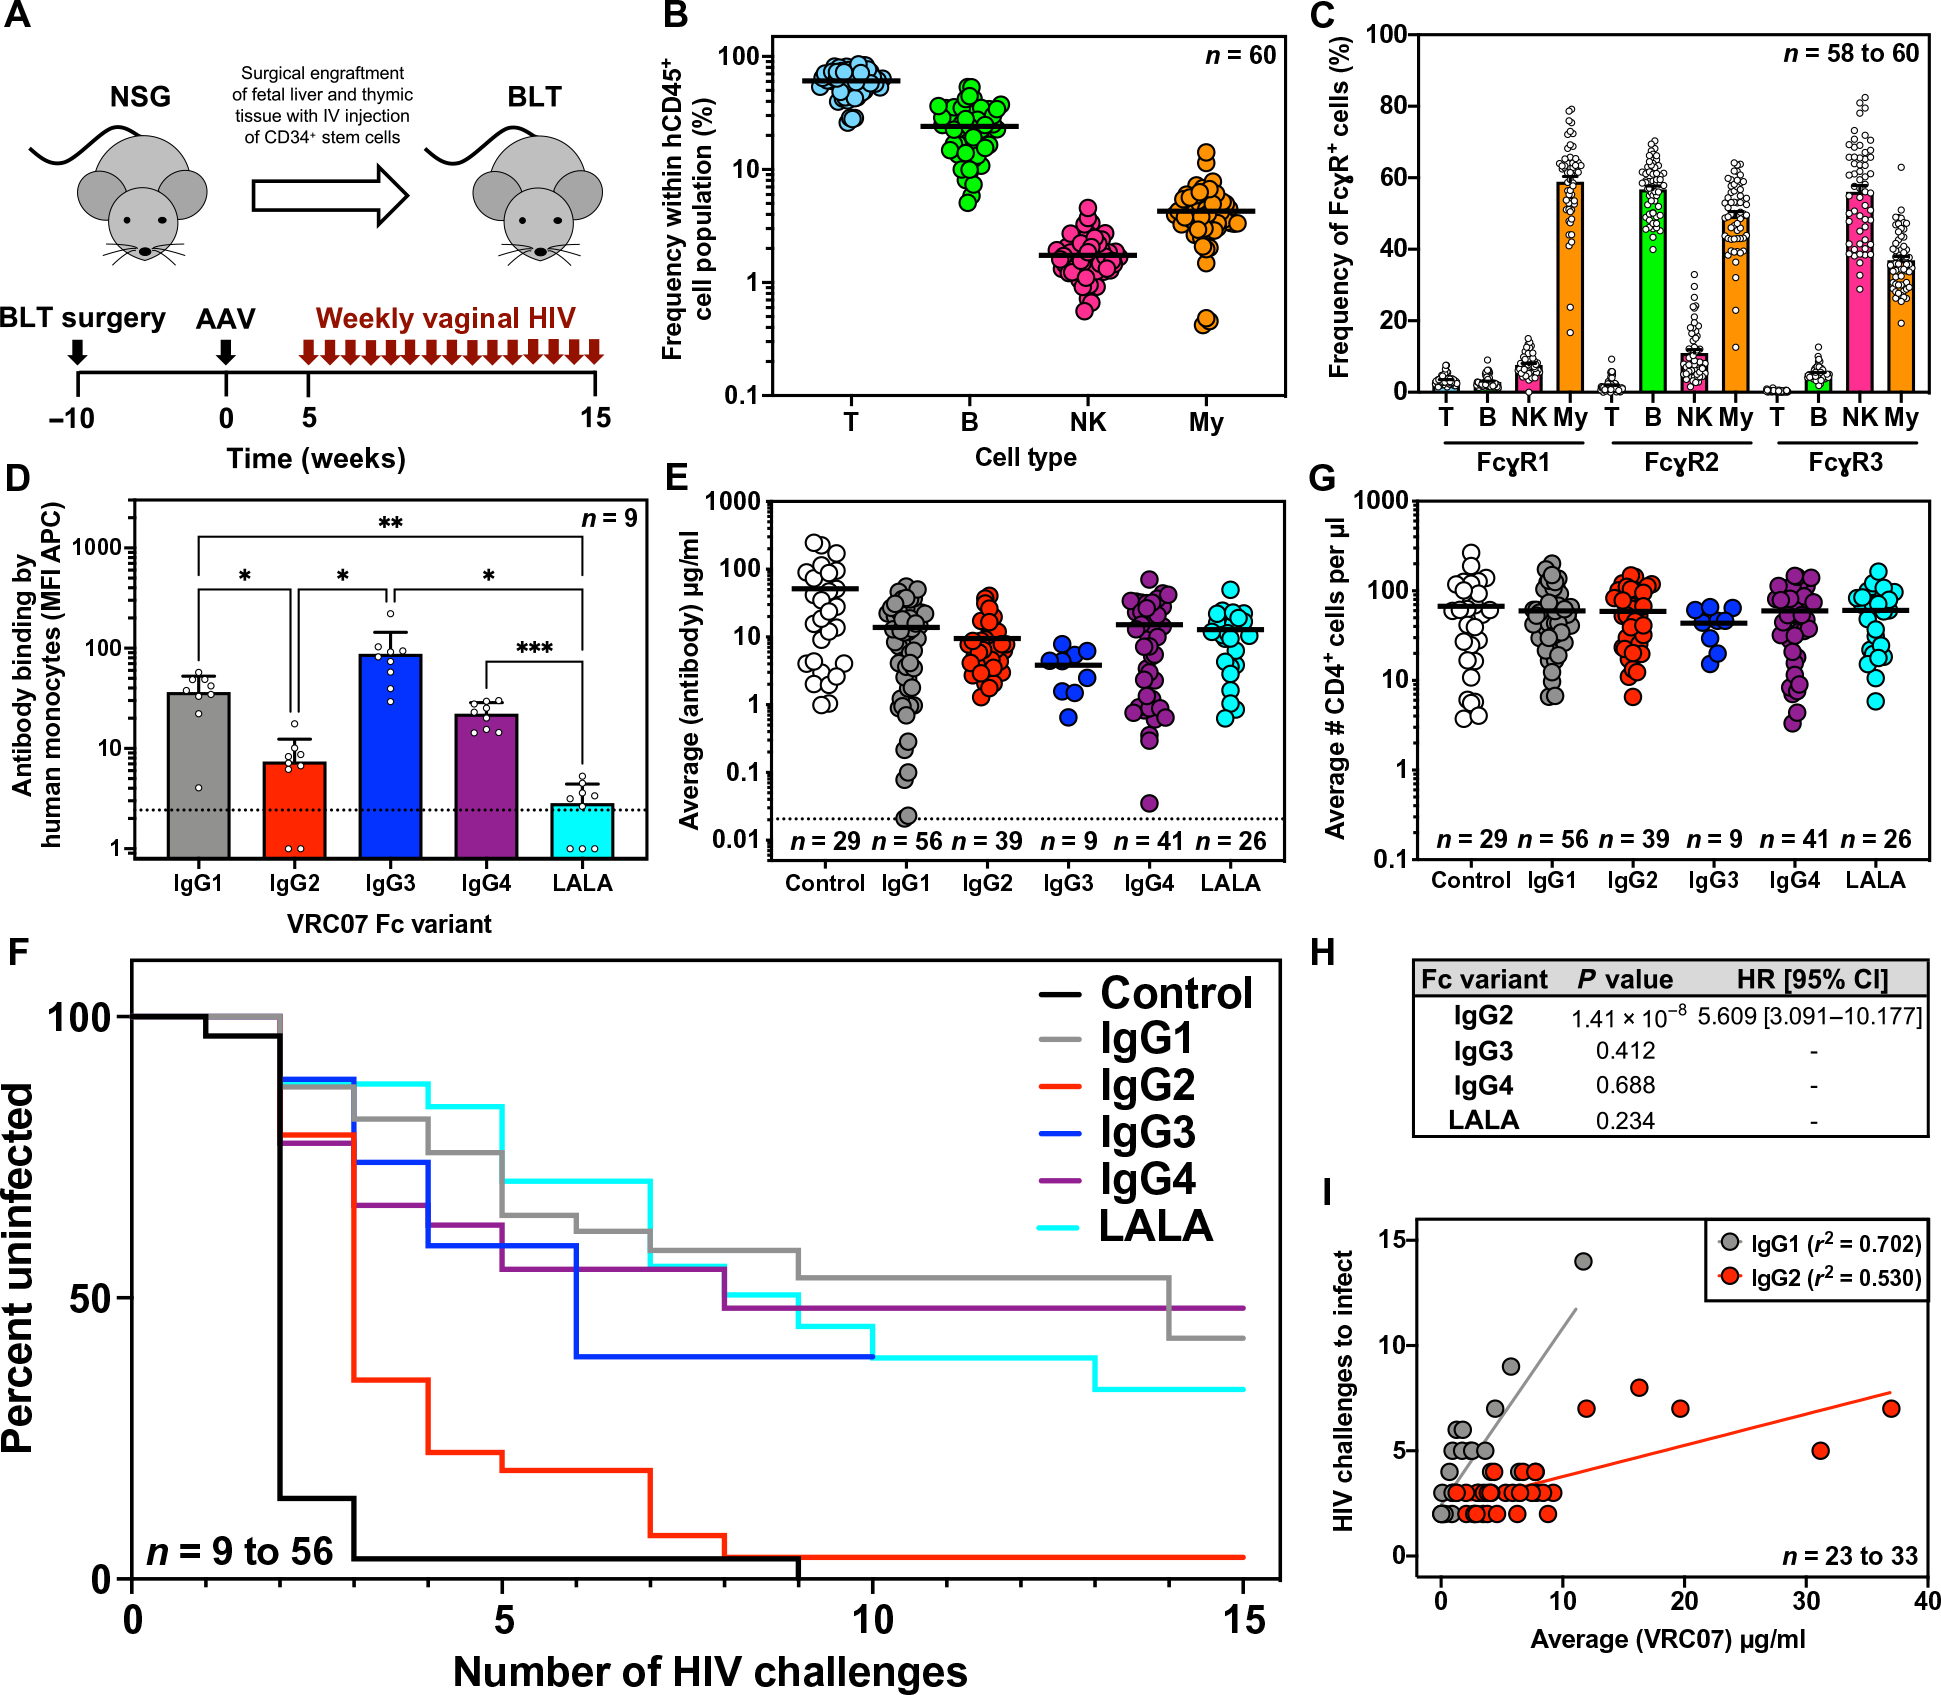
Fig. 4. VRC07 Fc variants exhibit distinct protective efficacy against repetitive HIV vaginal challenge in BLT humanized mice.

(A) Overview of BLT humanized mouse model and schematic representation of experimental timeline. IV, intravenous. (B) The frequency of human T cells (CD45+ and CD3+), B cells (CD45+ and CD19+), NK cells (CD45+, CD3−, CD19−, and HLA-DR−, CD56+), and myeloid cells (My; CD45+, CD3−, CD19−, CD11c+, and HLA-DR+) in the peripheral blood of uninfected BLT mice (n = 60) were measured at 10 weeks after surgical engraftment by flow cytometry. Horizontal bars represent the mean. (C) The percentages of the human immune cell subsets from (B) expressing human FcγR1, FcγR2, or FcγR3 were measured by flow cytometry. Bars represent the mean; error bars represent SEM. (D) Binding of AF647-labeled VRC07 Fc variants by human monocytes (CD45+, CD3−, CD56−, and CD14+) isolated from the spleens of BLT mice (n = 9) was measured across two separate BLT batches by flow cytometry. The dotted line indicates the average MFI in the absence of a VRC07 antibody. Bars represent the mean and SD with statistical significance determined by one-way analysis of variance with Tukey’s correction for multiple comparisons. *P < 0.02, **P < 0.01, and ***P < 0.001. (E) Average plasma antibody concentrations achieved in BLT mice from the start of vaginal challenges through HIV acquisition or death were measured. Mice were given 1.0 × 10¹⁰ to 2.5 × 10¹¹ GC of AAV expressing the given VRC07 Fc variant or a malaria-specific negative control IgG1 antibody, and plasma concentrations were measured weekly by gp120 or malaria-specific ELISA. Graphs represent combined data from three separate BLT experiments with the exception of VRC07 IgG3 (one experiment) and VRC07 LALA (two experiments). Horizontal bars indicate the mean. The dotted line indicates the limit of detection, 0.02 μg/ml, for the assay. (F) Kaplan-Meier survival curves are shown for mice expressing VRC07 Fc variants or a malaria-specific negative control IgG1 antibody after repeated intravaginal HIV challenge. (G) Average numbers of human CD4+ cells per microliter of blood in BLT mice from the start of vaginal challenges through HIV acquisition or death were measured by flow cytometry. Horizontal bars indicate the mean. (H) Cox regression analysis of the effect of Fc modulation on the rate of HIV acquisition across multiple BLT experiments controlled for antibody concentration is shown. A hazard ratio (HR) and 95% confidence interval (CI) are only reported if the P value was less than 0.05. (I) The relationship between the average circulating antibody concentration (micrograms per milliliter) and the number of HIV challenges required for infection to occur over the course of challenge in BLT humanized mice was plotted. Lines represent the result of a linear regression for mice expressing VRC07 IgG1 (n = 23 mice) or VRC07 IgG2 (n = 33 mice).
