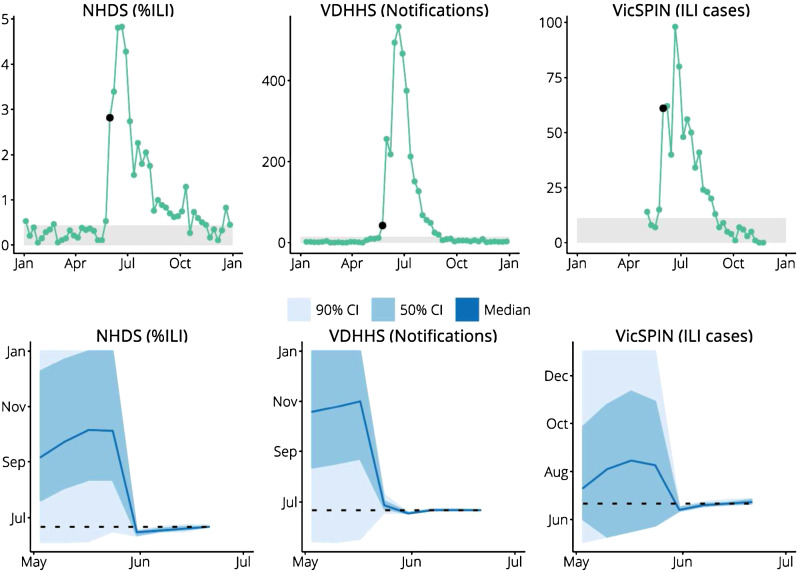
Fig. 6.
Retrospective forecasts for the 2009 H1N1 pandemic in Melbourne. The top row shows the surveillance data from each system (VDHHS notification counts modified as described in the text); black points indicate the time at which the variance in peak timing predictions rapidly decreased, the grey regions indicate values less than the background rate. The bottom row shows the confidence intervals of the peak timing predictions (y-axis) plotted against the forecasting date (x-axis) for the period prior to the actual peak. Peak timing was accurately predicted 3 weeks prior to the actual peak (NHDS and VicSPIN data) and 4 weeks prior to the actual peak (VDHHS data). NHDS, National Home Doctor Service; VDHHS, Victorian Department of Health & Human Services; VicSPIN, Victorian Sentinel Practice Influenza Network.

