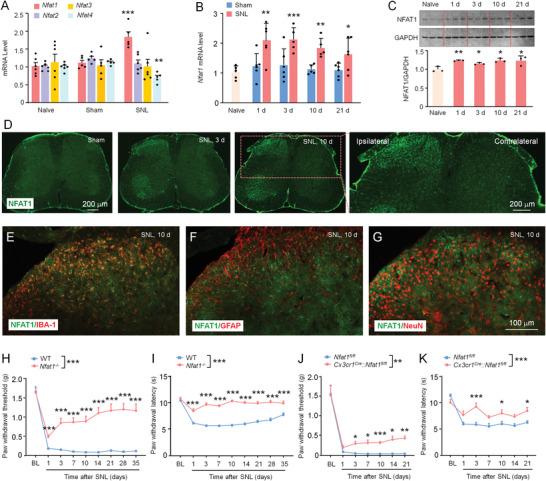
Figure 1.

NFAT1 expression is increased in spinal microglia after SNL. A) Real‐time PCR shows the mRNA expression of NFAT1–4 after SNL. ** P < 0.01, *** P < 0.001, SNL versus Sham; Student's t‐test, n = 5–6 mice per group. B) The time‐course of Nfat1 mRNA expression in the ipsilateral dorsal horn in naïve, sham‐ and SNL‐operated mice. * P < 0.05, ** P < 0.01, *** P < 0.001, SNL versus Sham. Student's t‐test, n = 5–6 mice per group. C) Western blot shows the increased NFAT1 expression in WT mice after SNL from day 1 to day 21. * P < 0.05, ** P < 0.01, SNL versus Naive. Student's t‐test, n = 3 mice per group. D) Immunostaining shows NFAT1 expression in the spinal cord of sham and SNL‐operated (day 3 and day 10) mice. E–G) Representative images of double staining of NFAT1 with IBA‐1 (E), GFAP (F), or NeuN (G). NFAT1 is highly colocalized with IBA‐1. H,I) SNL‐induced mechanical allodynia (F (1, 29) = 74.30, P < 0.0001, H) and heat hyperalgesia (F (1, 29) = 214.8, P < 0.0001, I) are markedly alleviated in Nfat1−/− mice compared with WT mice. *** P < 0.001, two‐way RM ANOVA followed by Bonferroni's tests, n = 15–16 mice per group. J,K) Nfat1‐cKO mice exhibit alleviated mechanical allodynia (F (1, 16) = 13.64, P = 0.002, J) and heat hyperalgesia (F (1, 16) = 64.75, P < 0.0001, K). * P < 0.05, ** P < 0.01, *** P < 0.001, two‐way ANOVA followed by Bonferroni's multiple comparisons test, n = 9 mice per group.
