Figure 3.

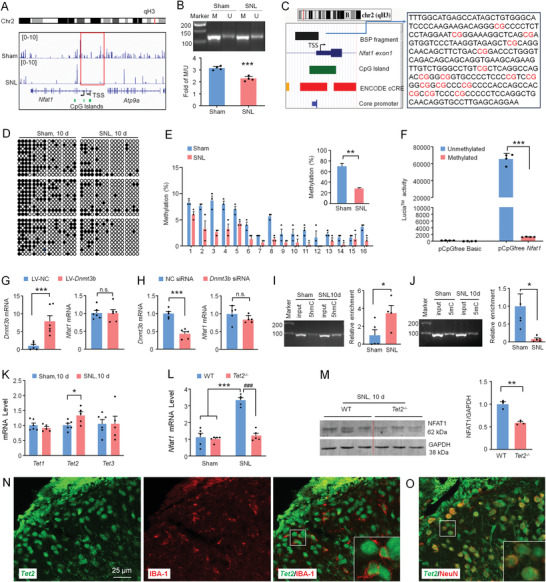
NFAT1 expression is regulated by TET2‐mediated DNA methylation. A) Integrative Genome Browser images were created from MeDIP‐seq data for Nfat1 gene loci. Black arrows show the transcription start site (TSS) of Nfat1. The red box shows a differentially methylated peak upstream of the Nfat1 gene between sham and SNL. The green blocks represent the location of the CpG islands. B) MSP analysis for Nfat1 in the dorsal horn collected from Sham and SNL mice. M and U represent methylated and unmethylated bands, respectively. *** P < 0.001, SNL versus Sham. C) Left panel: schematic of a CpG island (green block) locus and BSP target fragment (black block) in the promoter of Nfat1 depicted by the UCSC Genome Browser. Right panel: BSP target fragment. CpG dinucleotides are marked with red font. D) The methylation status of Nfat1 in the sham‐ and SNL‐operated mice (filled circle, methylated CpG; hollow circle, unmethylated CpG). E) The total methylation of Nfat1 promoter is decreased after SNL. **P < 0.01, SNL versus Sham, Student's t‐test, n = 3. F) Methylated luciferase reporter assay shows a decreased luciferase activity of the methylated Nfat1 promoter compared to the unmethylated one. ***P < 0.001. Student's t‐test, n = 4. G) Overexpression or H) knockdown of Dnmt3b does not affect the expression of Nfat1. ***P < 0.001. n.s., no significance. Student's t‐test, n = 6. Levels of I) 5 hmC and J) 5 mC of Nfat1 promoter determined by meDIP‐ and hmeDIP‐qPCR, respectively. SNL upregulates 5 hmC level but downregulates 5mC level. *P < 0.05, SNL versus Sham. Student's t‐test, n = 4–5. K) Tet1‐3 mRNA expression in the spinal cord of sham and SNL mice. SNL upregulates Tet2 expression. *P < 0.05, SNL versus Sham. Student's t‐test, n = 5–6. Tet2 −/− mice show L) reduced Nfat1 mRNA and M) protein after SNL. **P < 0.01, ***P < 0.001, WT‐SNL versus WT‐Sham, ### P < 0.001, WT‐SNL versus Tet2 −/−‐SNL. Student's t‐test, n = 5 for mRNA, and n = 3 for protein. N,O) Combined fluorescent in situ hybridization and immunofluorescence demonstrate Tet2 mRNA in IBA1‐labeled microglia (N) and NeuN‐labeled neurons (O) in the spinal cord dorsal horn.
