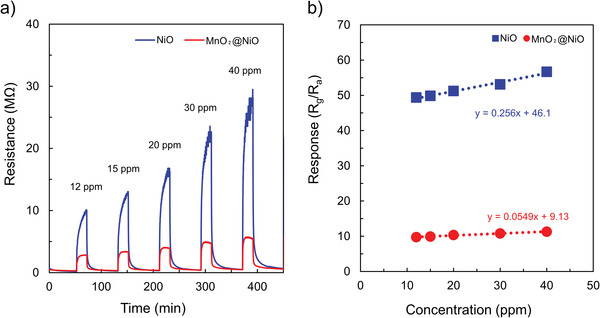
Figure 6.

a) Dynamic curve of the gas sensors exposed to different allyl mercaptan concentrations at the optimal temperature of NiO and MnO2@NiO. b) Linear fit of the responses as a function of allyl mercaptan concentration at optimal temperatures of NiO and MnO2@NiO.
