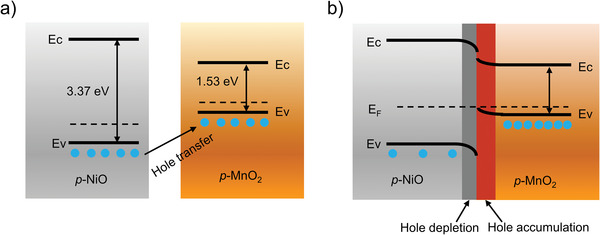
Figure 9.

Energy band diagrams of NiO and MnO2 a) before and b) after contact. (E F is Fermi energy level, E C is the bottom of the conduction band, and E V is the top of the valence band.).

Energy band diagrams of NiO and MnO2 a) before and b) after contact. (E F is Fermi energy level, E C is the bottom of the conduction band, and E V is the top of the valence band.).