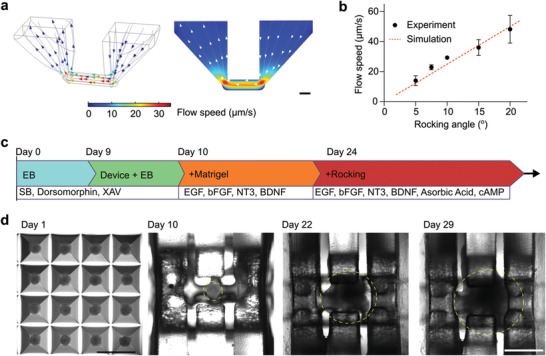
Figure 2.

On‐chip culture of human cortical organoids. a) The simulation results indicate the 3D distribution (left) and side view (right) of flow profiles within the device. b) The experimental results describe the flow speed under different rocking angles (rocking frequency = 0.1 rpm). c) The illustration shows the protocol and time of the on‐chip culture of human cortical organoids. d) Top‐down view images of organoids during the differentiation and on‐chip culture process (organoids in yellow dashed circles). Scale bar: 1 mm.
