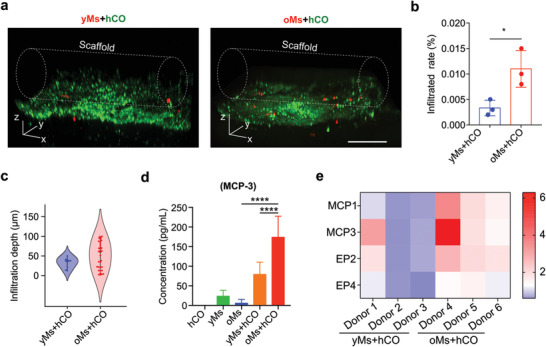
Figure 4.

Characterization of monocyte inflitrating organoid. a) Comparison of infiltration capacity of monocytes isolated from old donors (>60‐year‐old) into on‐chip cultured human cortical organoid (oMs+hCO) with monocytes isolated from young donors (20 to 30‐year‐old) into on‐chip cultured human cortical organoid (yMs+hCO). Scale bar: 200 µm. b) Quantification of infiltrated monocytes in “yMs+hCO” and “oMs+hCO” groups, n = 3. c) Violin plot showing infiltration depth distribution of monocytes into the organoids in both yMs+hCO and oMs+hCO groups. d) ELISA analysis of MCP‐3 concentrations in supernatant isolated from hCO, yMs, oMs, yMs+hCO, and oMs+hCO cultures, n = 6. e) The plot of gene expression change (2−ΔΔCt) heatmap of the “yMs+hCO” and “oMs+hCO” groups on day 29 under the same experimental conditions, n = 3.
