Figure 3.
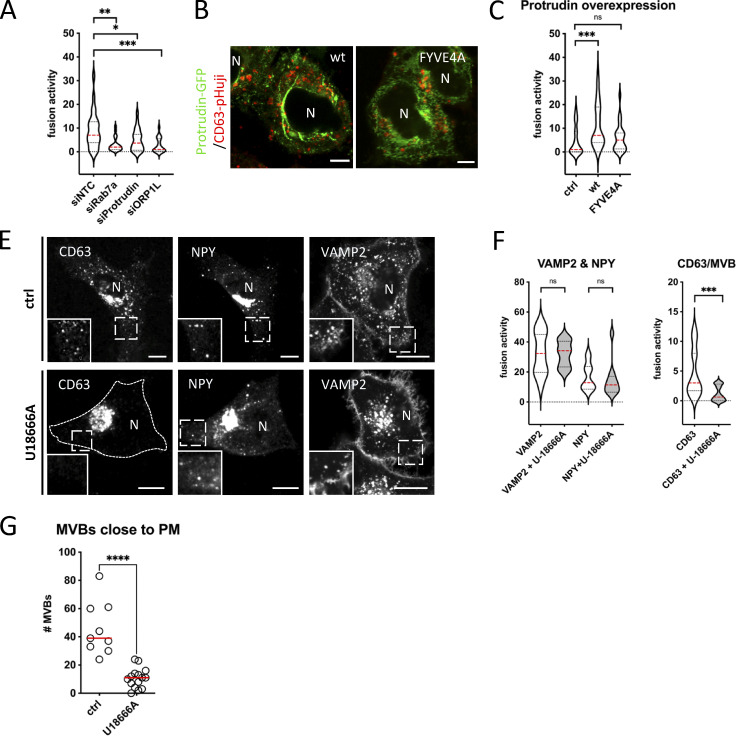
ER-LE MCSs impact fusion activity—protrudin & U18666A. (A) MVB/PM fusion activity in RNAi-treated CD63-pHluorin HeLa cells depleted for Rab7a, Protrudin or ORP1L. NTC, non-targeting control. Measured over >60 cells from n = 3 experiments using Student’s two-tailed two-sample t test. Red line indicates median. (B) Fluorescent analysis of protrudin-wt or -FYVE4A (GFP) overexpressing CD63-pHuji HeLa cells after fixation. (C) MVB/PM fusion activity in protrudin-wt or -FYVE4A overexpressing CD63-pHuji HeLa cells compared to control. Measured over >30 cells from n = 3 experiments using Student’s two-tailed two-sample t test. Red line indicates median. (E) Confocal analysis of CD63, NPY- and VAMP2-pHluorin HeLa cells treated with 2 μg/ml U18666A (inset sizes are 6.1, 6.7 and 3.8 µm for control, and 3.7, 4.7 and 3.6 µm for U18666A condition, respectively). (F) Effect of U18666A treatment on PM fusion activity of VAMP2/NPY transport vesicles (left) and MVBs (right). Measured over >40 cells from n = 3 experiments using Student’s two-tailed two-sample t test. Red line indicates median. (G) Graph showing the number of acidic vesicles close to the PM in control and U18666A-treated cells. Measured over >4 cells in n = 2 experiments using Student’s two-tailed two-sample t test. Red line indicates median. Bars: 5 µm.

