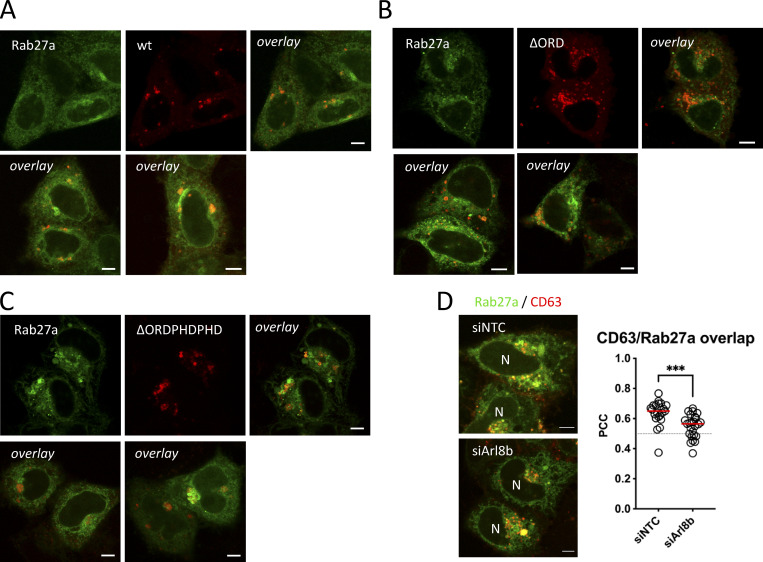
Figure S7.
Supplemental data related to Fig. 5. (A–C) Fluorescent analysis for Rab27a-GFP (green) HeLa co-expressing (A) mCherry-ORP1L-wt, (B) -∆ORD, or (C) -∆ORDPHDPHD (red). (D) Co-localization analysis of Rab27a-GFP/CD63-pHuji co-expressing HeLa, treated with siArl8b. To the right: quantification of Rab27a-GFP/CD63-pHuji overlap in ctrl (siNTC) or Arl8b (siArl8b) depleted condition. Bars: 5 µm.

