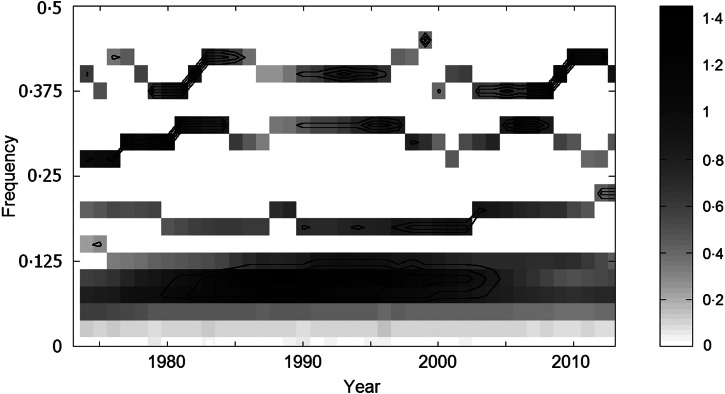
Fig. 8.
Time-frequency (multivariate synchrosqueezing method) localization of the oscillations which the six regional tick-borne encephalitis incidence series exhibit in common; grey tones correspond to the degree to which the oscillations are synchronized, and the concentric lines indicate the respective (from outer to inner) 80%, 90%, and 95% levels at which randomness can be excluded (based on 100 (×6) Monte Carlo simulations of the series under H0). Note four bands – common oscillations of the wavelengths varying around 2·5, 3·2, 5·3, and 10·5 years, respectively.

