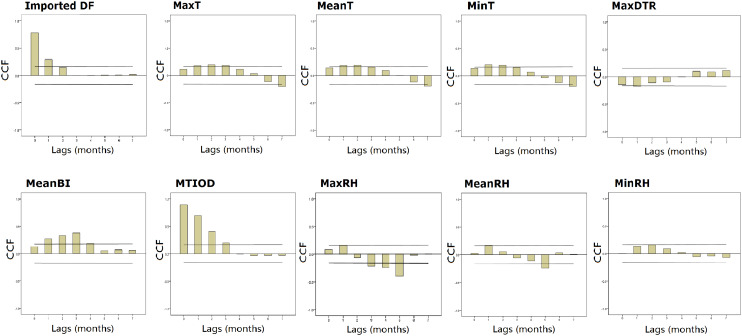
Fig. 3.
Plots of cross-correlation function (CCF) between monthly DF incidence rates separately and mosquito density, diurnal temperature range, timeliness of diagnosis and meteorological variation during January 2001 to December 2013 in Zhongshan, China. The two dashed lines illustrate critical values for cross-correlation (at the 5% level).

