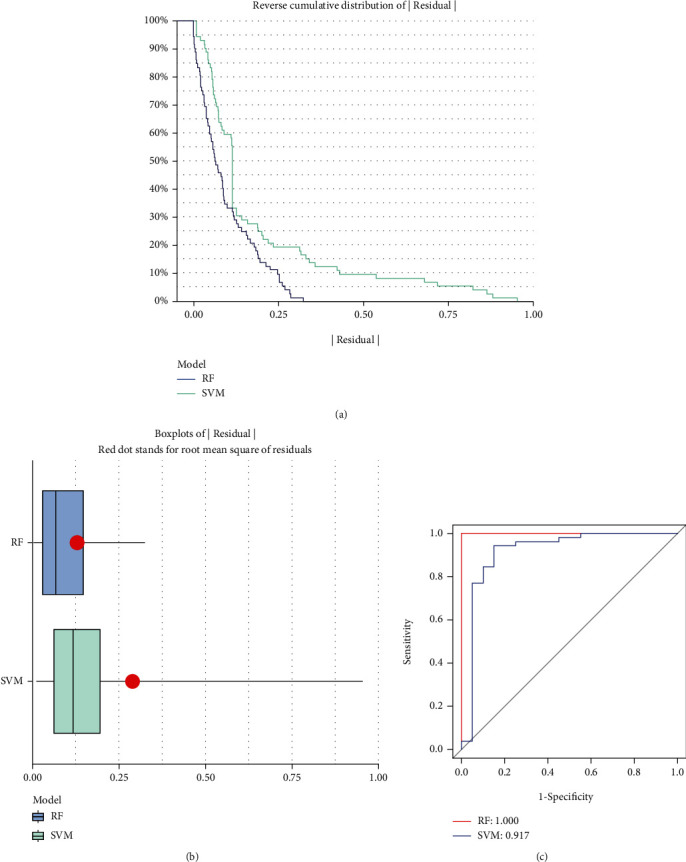
Figure 3.

Establishment of random forest model and support vector machine model. (a) The RF and support vector machine (SVM) residual distributions are plotted using the reverse cumulative distribution of residuals. (b) The residual distribution of the RF and SVM models is depicted using boxplots. (c) ROC curves demonstrate the accuracy of the RF model and the SVM model.
