Figure 6.

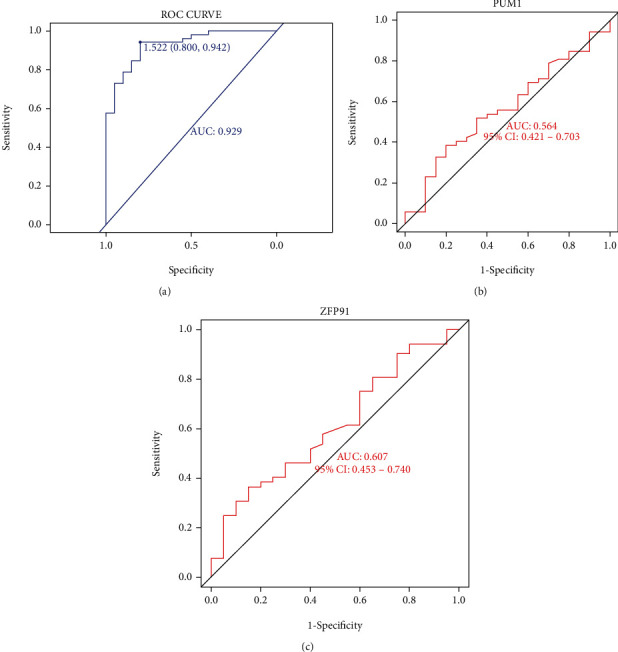
Validation of nomogram model in the diagnostic value. (a) ROC curve analysis of nomogram model. (b) ROC curve analysis of gene PUM1 model. (c) ROC curve analysis of gene ZFP91 model.

Validation of nomogram model in the diagnostic value. (a) ROC curve analysis of nomogram model. (b) ROC curve analysis of gene PUM1 model. (c) ROC curve analysis of gene ZFP91 model.