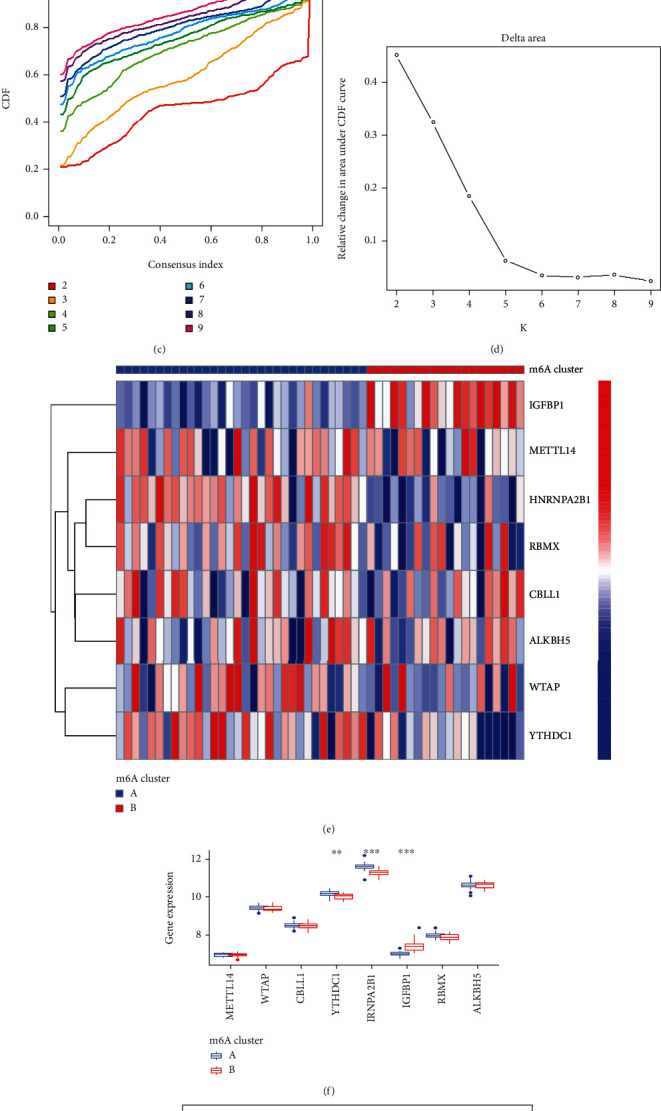
Figure 7.

Consensus clustering of the 8 distinct RNA N6-methyladenosine (m6A) regulators in AS patients. (a) The consensus clustering matrix at k = 2. (b) The consensus clustering matrix at k = 3. (c) CDF curve for k = 2 to 9. (d) The relative variation of the area under the CDF curve that k is from 2 to 9. (e) Expression heat map of the 8 significant m6A regulators in cluster A and cluster B. (f) Differential expression histogram of the 8 significant m6A regulators in cluster A and cluster B. (g) Principal component analysis on the expression profiles of the 8 significant m6A regulators that shows a remarkable difference in transcriptomes between the two m6A patterns ∗p < 0.05, ∗∗p < 0.01, and ∗∗∗p < 0.001.
