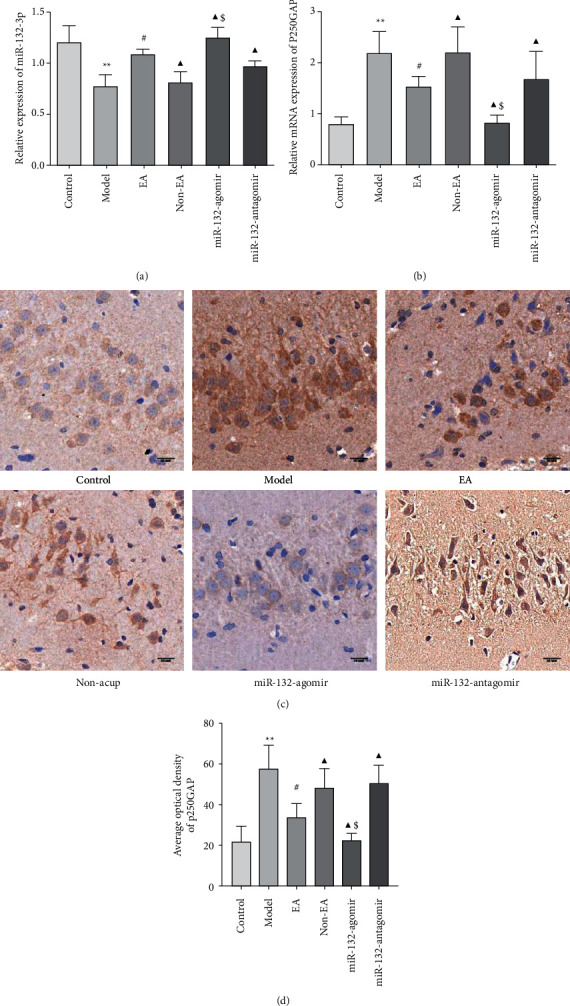
Figure 4.

Effect of EA on the miR-132-3p and p250GAP in REMSD model rats (a), the miR-132-3p expression level in each group and (b), quantification of p250GAP mRNA expression in each group by qRT-PCR (c), the representative pictures of p250GAP immunohistochemistry staining. Scale bars, 50 μm (d), the average optical density of p250GAP was measured by Image J software in the hippocampal slices. Data were presented as the mean ± s.d. One-way ANOVA was used for panels (a–d). ∗P < 0.05, P < 0.01 versus control group; #P < 0.05 versus model group; ▲P < 0.05 versus EA group; $P < 0.05 vs. Non-EA group. n = 3 per group.
