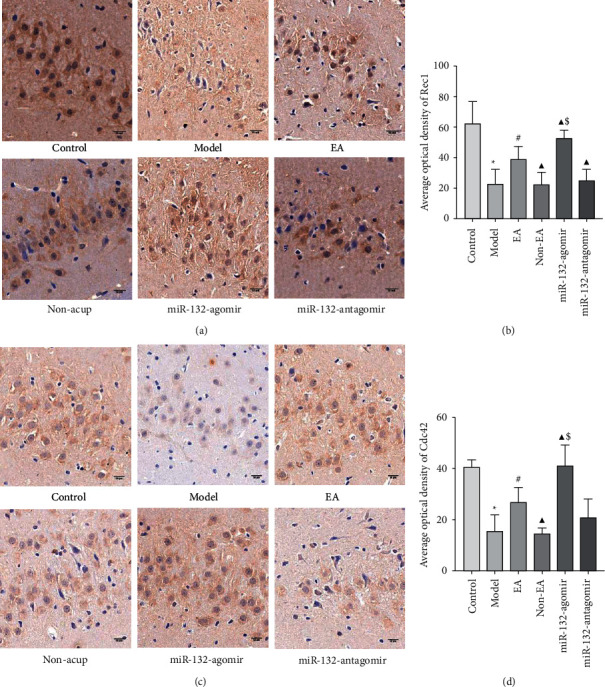
Figure 5.

EA increased the protein expression of Rac1and Cdc42 in the hippocampus of REMSD rats (a, c), representative pictures of Immunohistochemistry staining in the hippocampal slices of each group of rats, scale bars, 50 μm (b, d), the average optical density of Rac1and Cdc42 in each group were measured by Image J software. Data were presented as the mean ± s.d. One-way ANOVA was used for panels (a–c). ∗P < 0.05 versus control group; #P < 0.05 versus model group; ▲P < 0.05 versus EA group; and $ P < 0.05 versus non-EA group. n = 3 per group.
