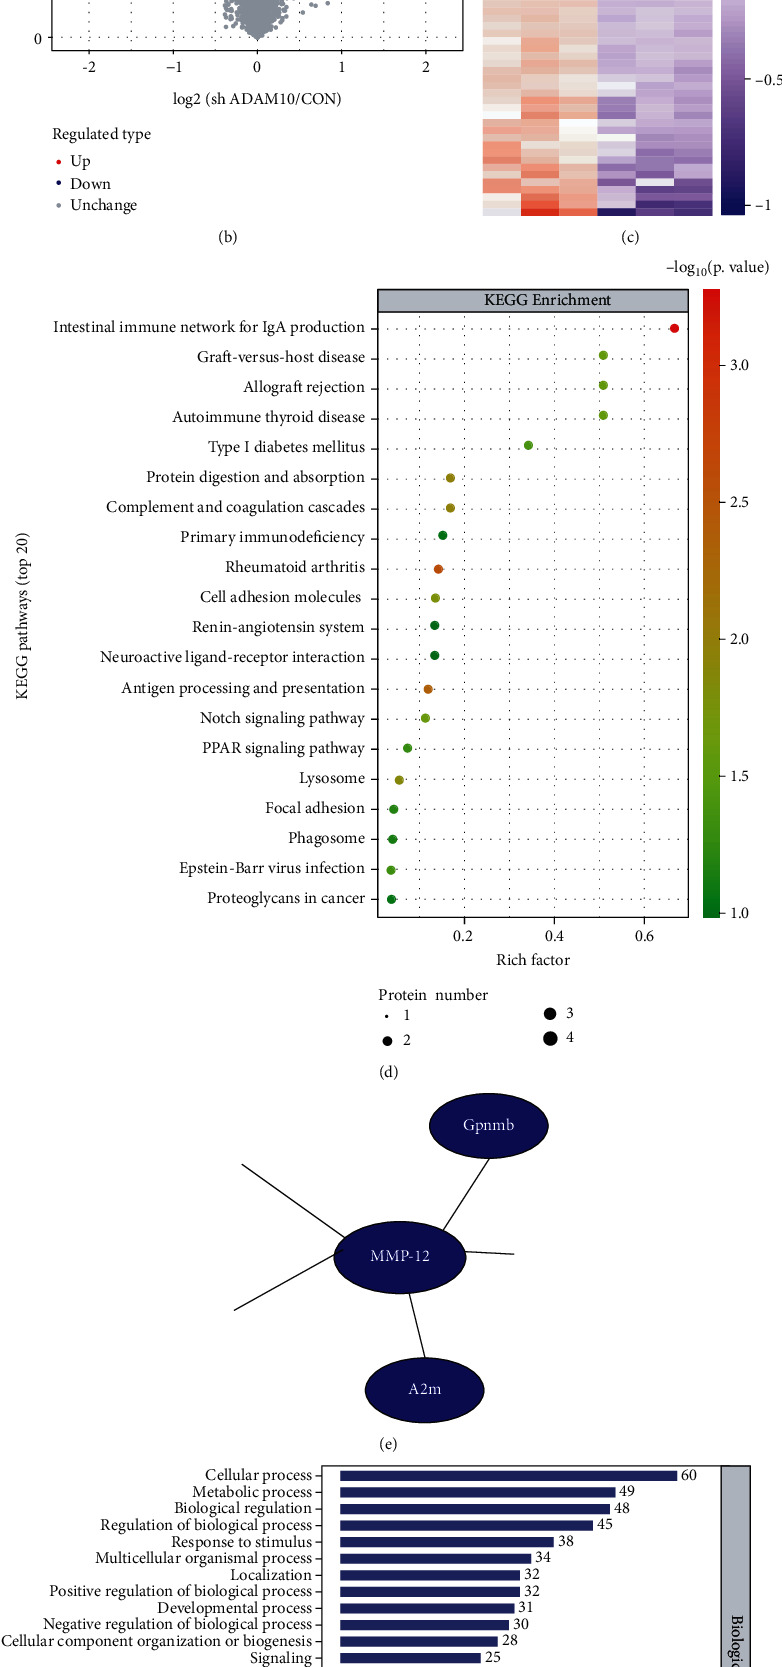
Figure 1.

A disintegrin and metalloprotease 10 (ADAM-10) depletion induces matrix metalloproteinase 12 (MMP-12) disorders in RAW264.7 cells. (a) ADAM-10 interference in RAW264.7 cells. Scale bar = 100 μm. The dot plots show the statistical analysis of the expression level of ADAM-10 via qualitative PCR (qPCR). Each dot represents a readout. (b) Tandem mass tag (TMT) results; 40 proteins were downregulated and 30 proteins upregulated in ADAM-10 RAW264.7 depleted cells compared to control cells. Each dot represents a readout. (c) Hierarchical clustering analysis results of the significant proteins from (b). Results are shown in a heat map. (d) KEGG pathway analysis of the different proteins. (e) Protein interaction network analysis revealing that interfered ADAM-10 (sh ADAM-10) decreases MMP-12 expression. (f) Biological Process Gene Ontology (GO) term enrichment analysis results for the different proteins.
