
Figure 1.
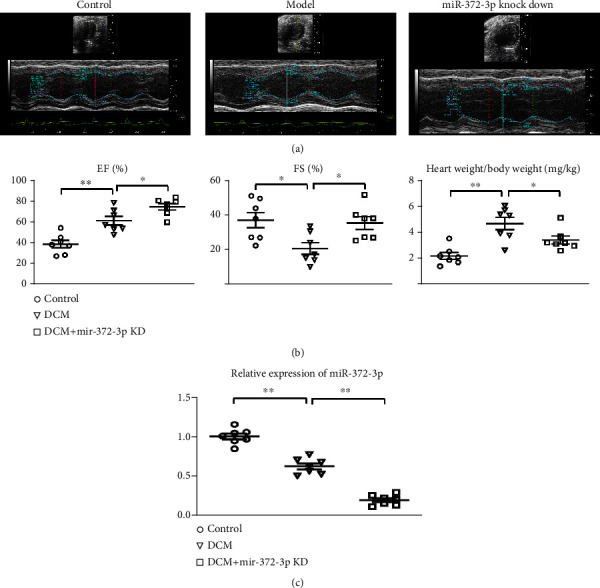
Effect of miR-372-3p KD on cardiac dysfunction. (a) Representative echocardiography in the control, model, and miR-372-3p KD groups. (b) Statistical analysis for LVFS, LVEF, and HW/BW ratio in the control, model, and miR-372-3p KD group. (c) RT-qPCR analysis of relative expression of miR-372-3p. n = 7/group, ∗∗P < 0.05: model group vs. miR-372-3p KD group. HW/BW: heart weight/body weight.